What is DDNet?
DDNet is a web server to search diseases and download their network estimated using the PubMed literature mining. Here, an edge between two diseases indicates high partial correlation between this disease pair, where correlation between two diseases is estimated based on the similarity in their gene association patterns. Users can check the queried disease network visually using our interface and also download it, along with its adjacency matrix and raw data. Our interface allows users to investigate relationship among various diseases while the obtained disease network can also be used for various downstream analyses, especially as a prior disease graph for the R package GGPA, among others.
Interface
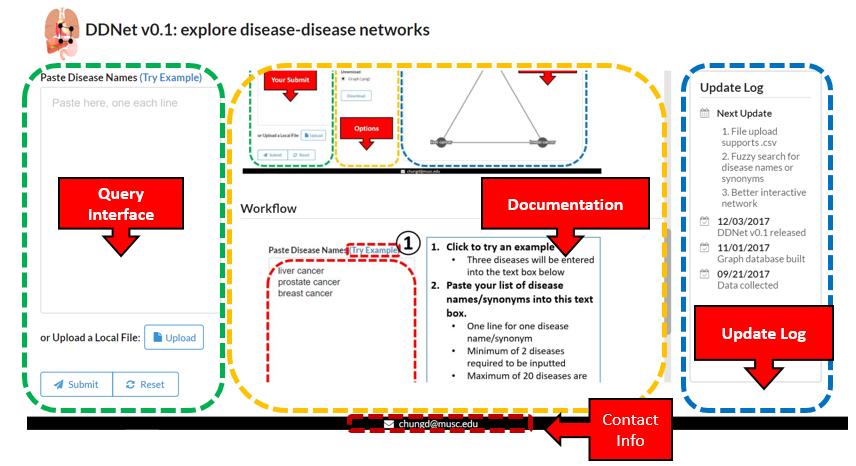
Interface Before Query
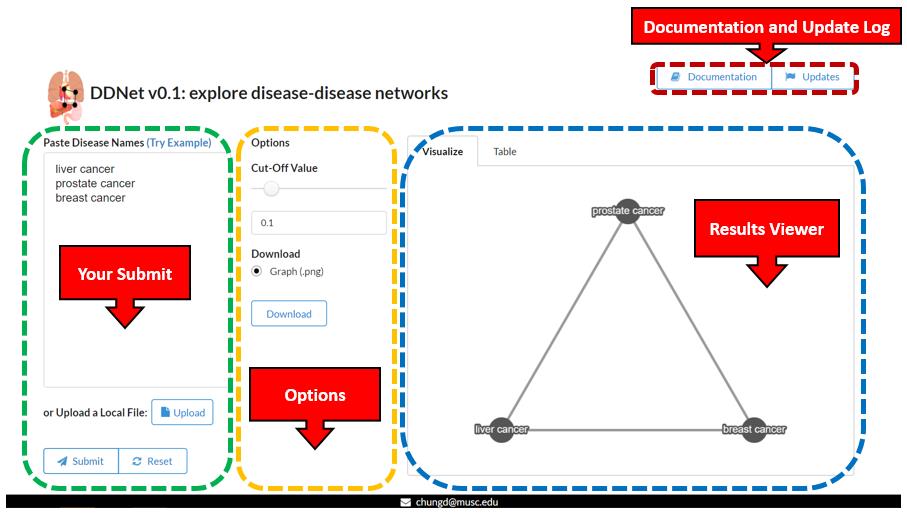
Interface After Query
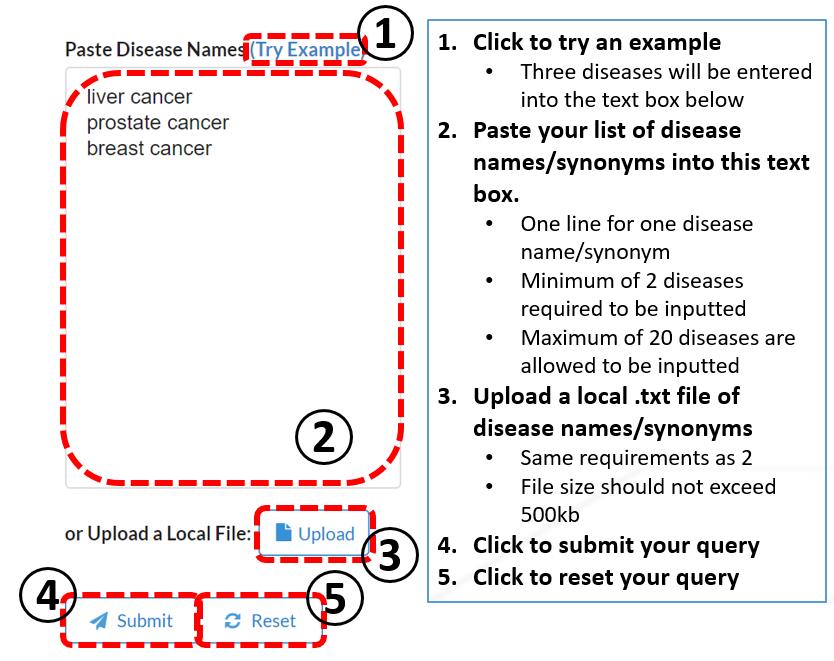
Workflow
Results
Visualization
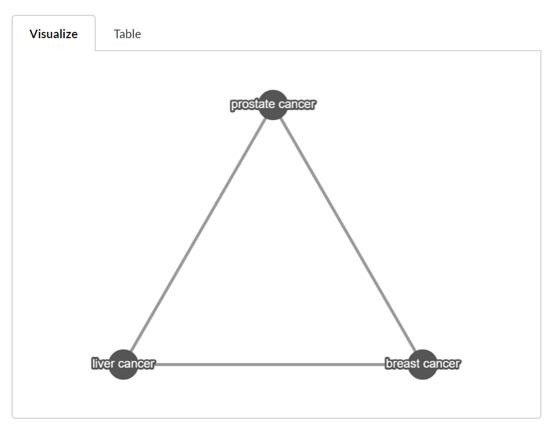
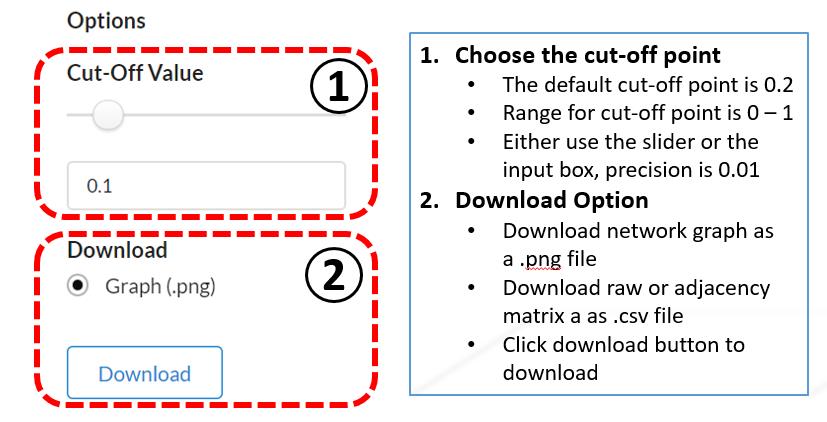
The visualization is implemented using cytoscape.js. The network graph is constructed based on the adjacency matrix calculated based on the raw partial correlation matrix with the user-defined cut-off point. User can use mouse wheel to zoom the graph. The download is available in the options tab
Partial Correlation Matrix & Adjacency Matrix
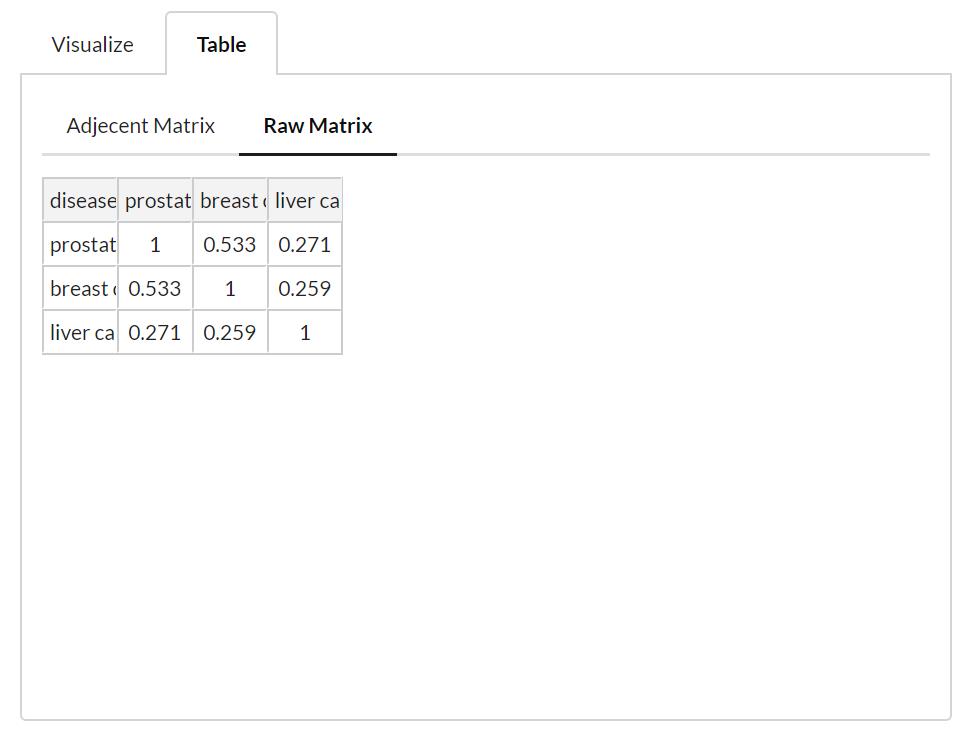
The partial correlation matrix is calculated from the correlation matrix of the returned list of diseases. When a cut-off is set, the adjacency matrix is built based on the partial correlation matrix (raw matrix), where value >= cut-off point is set to be 1, the others are set to 0. In the network visualization, if value is 1 between two disease nodes, a edge is made to connect these two nodes.
Options
Errors
Errors
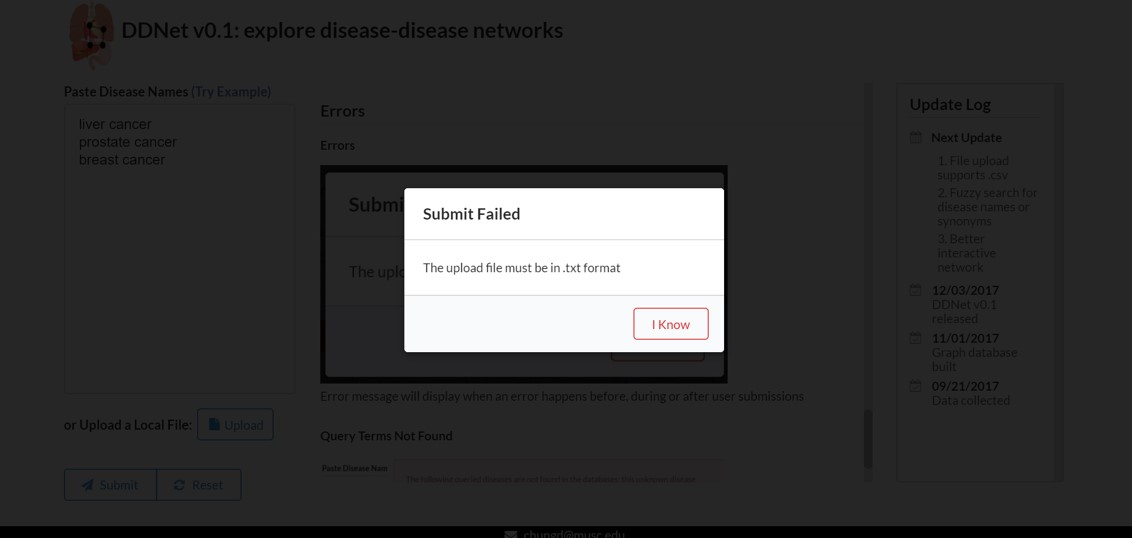
Error messages will display when an error happens before, during or after user submissions. Clicking on 'I Know' to dismiss the a error message
| Error Messages | Comments |
|---|---|
Either pasting or uploading a list of diseases is required |
If you are trying to submit without pasting or uploading any disease names/synonyms, you will get this error message. |
A minimum submission of two diseases are required |
You are submitting only one disease or check if you don't separate the diseases by line when pasting the diseases or uploading the file. |
Currently we only support submitting a maximum of 20 diseases |
Considering the purpose to use the disease-disease network graph, we restrict the maximum of diseases at one submission to 20. If you are submitting with more than 20 disease names/synonyms, you will get this error message. |
The maximum file size should not exceed 500kb |
When uploading the file, the file size is limited to 500kb. |
The upload file must be in .txt format |
Currently, we only support uploading a plain text file. |
Oops, query failed due to a server error |
This is a server-side error when you are submitting your query. This is a problem with our server not you, so please wait for a while and try again, or contact us through the contact information. |
Cut-off value must between 0-1 |
When changing the cut-off points in the input box, entering a cut-off point beyond 0-1 range will give this error. |
Query Terms Not Found

If a queried term is not found in the database, an error will show in the results saying this term is not found
 DDNet v0.1: explore disease-disease networks
