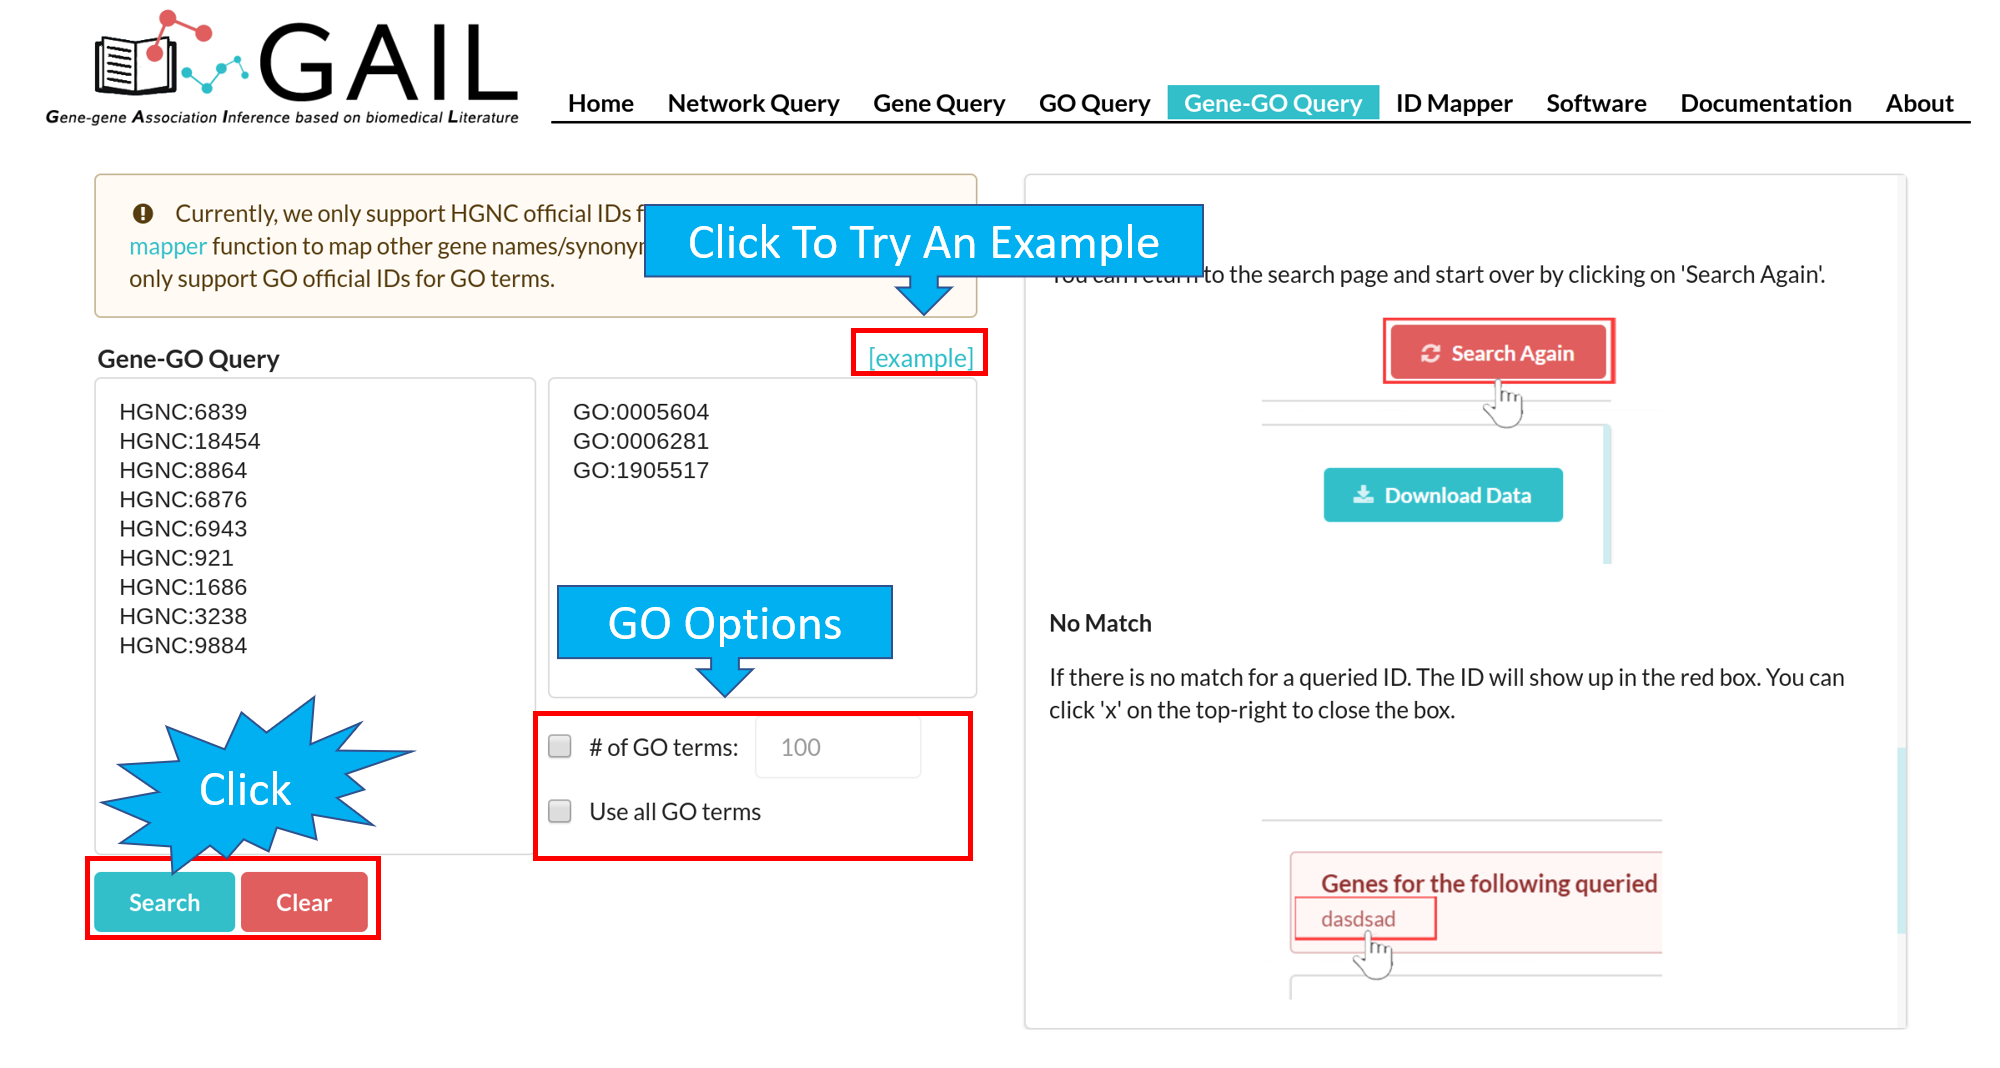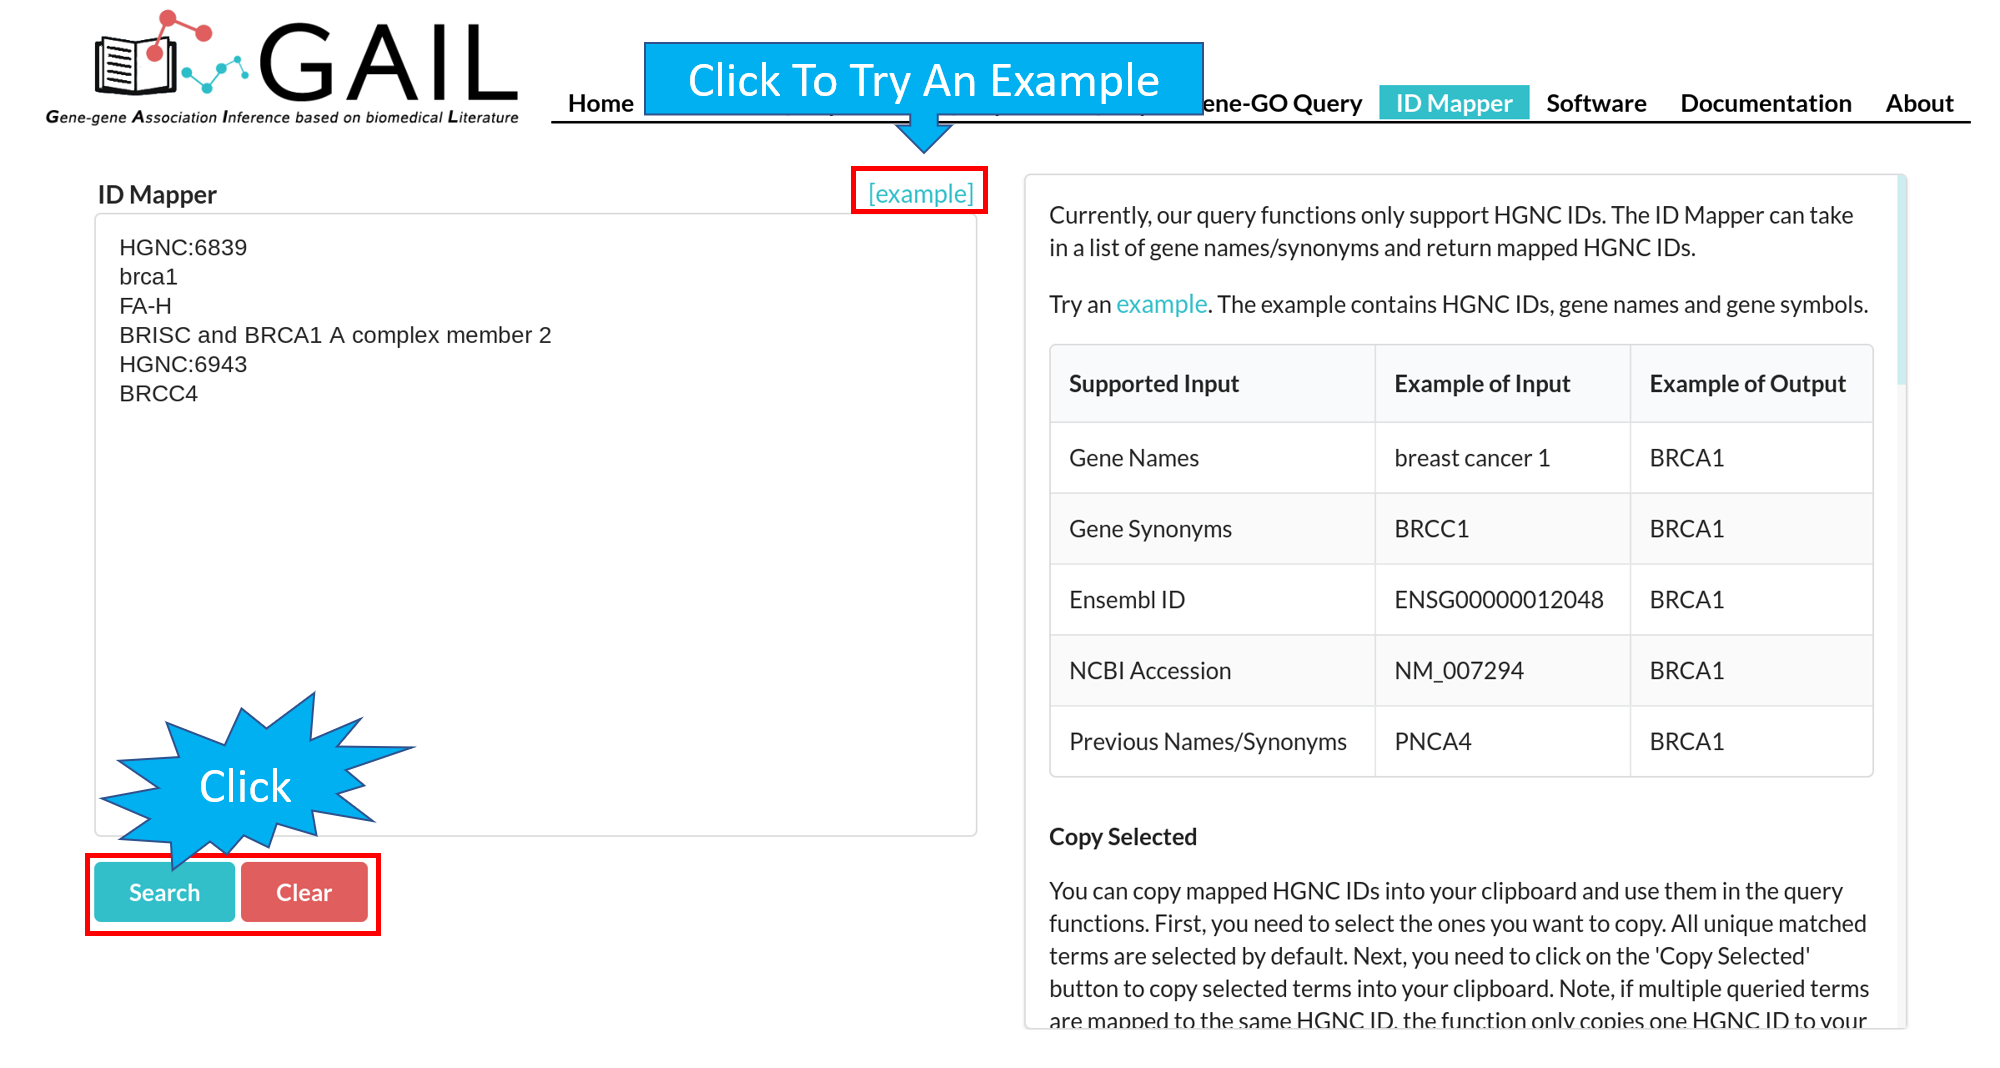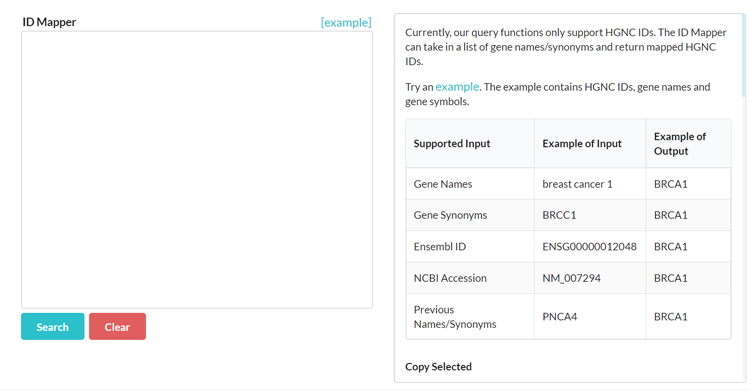
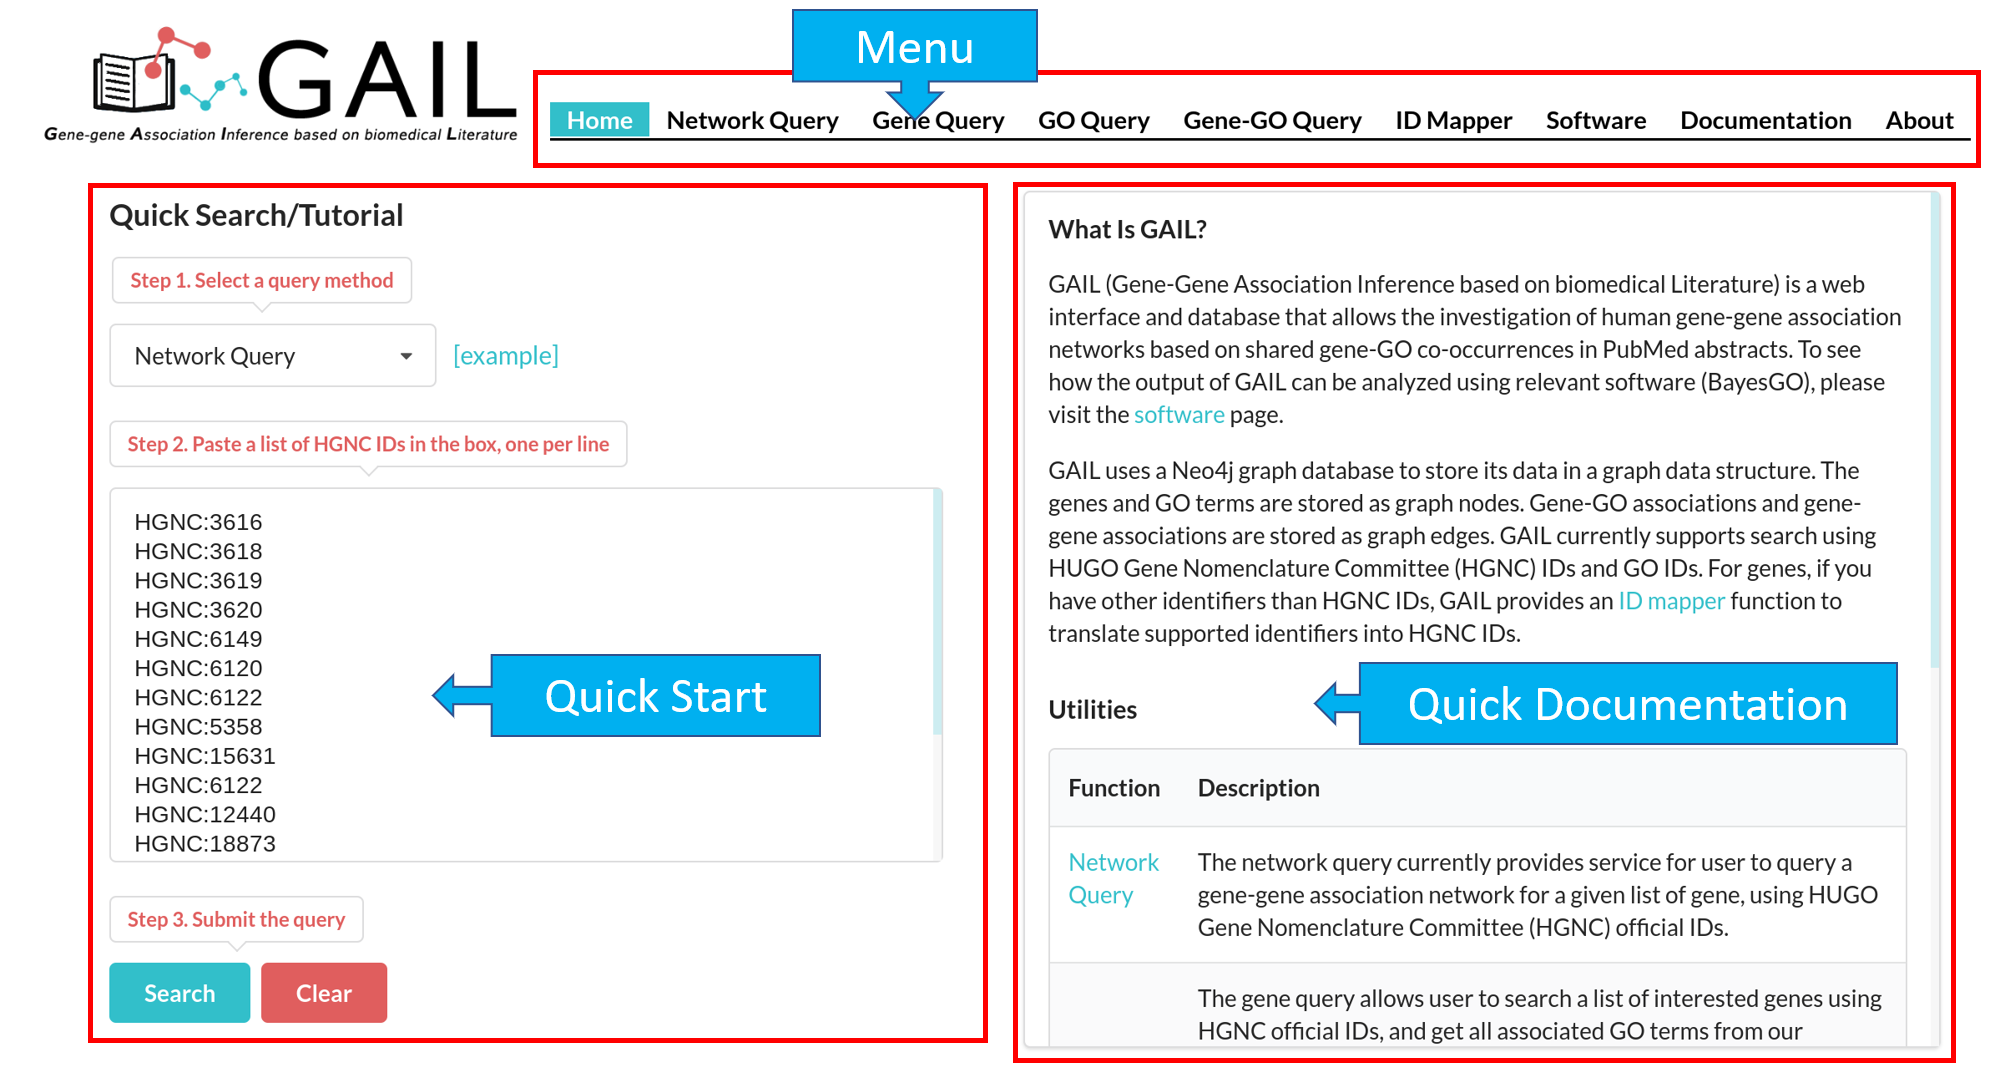
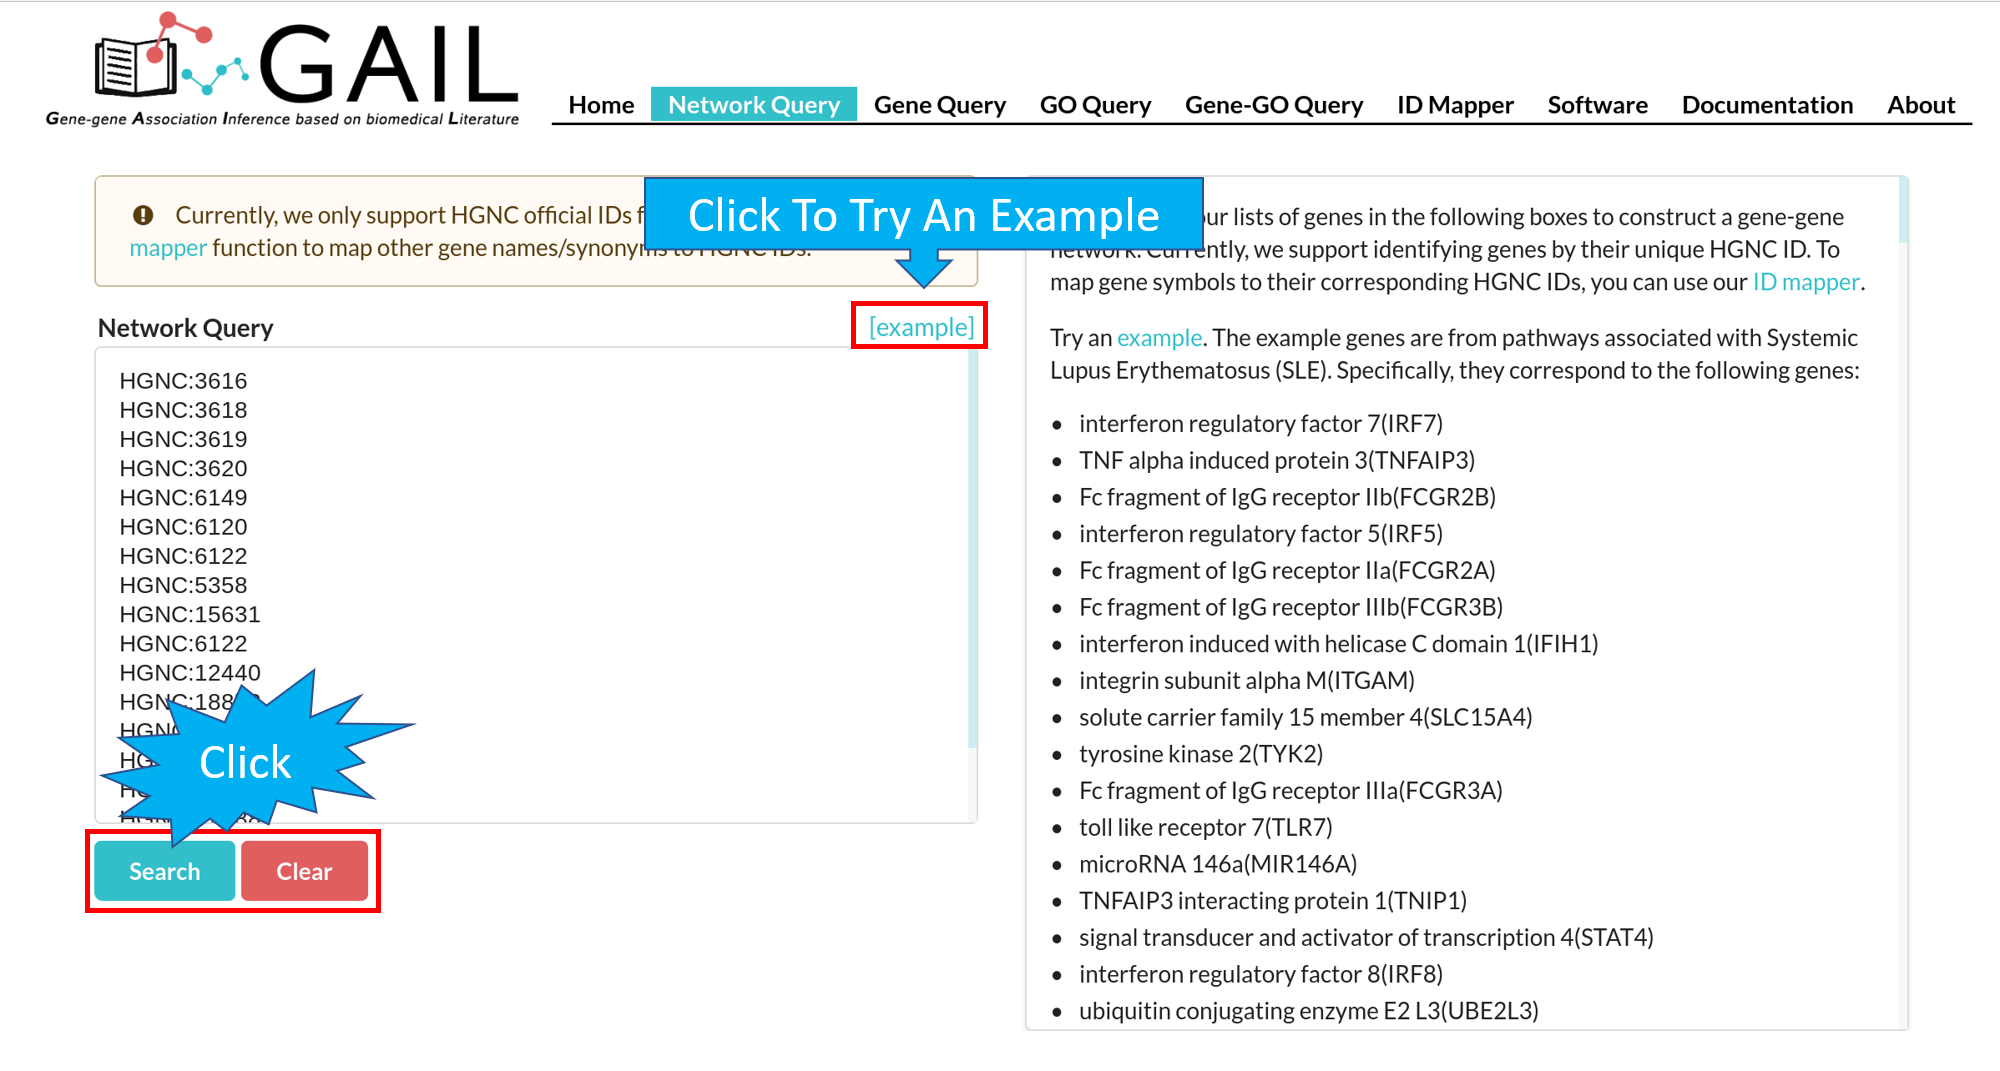
Network Query Search
Network Query Results
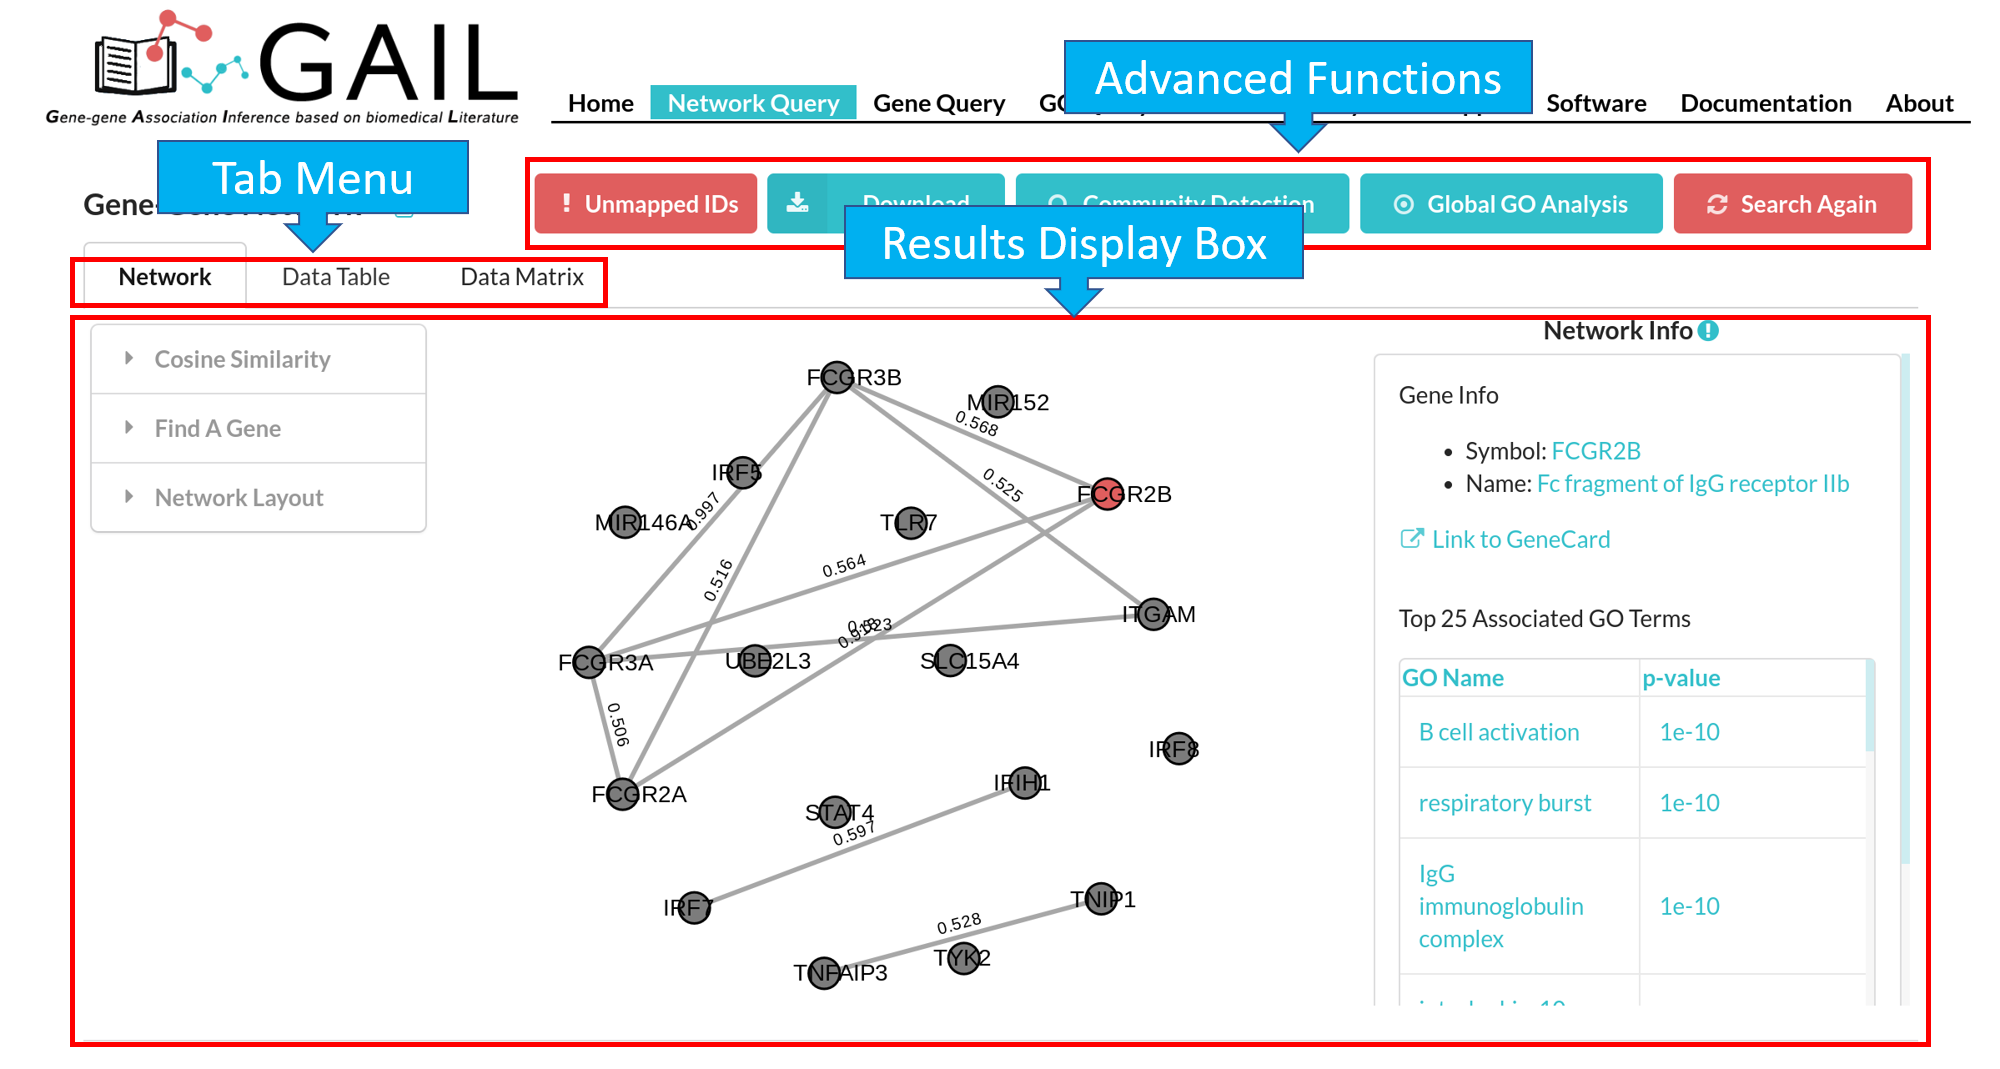
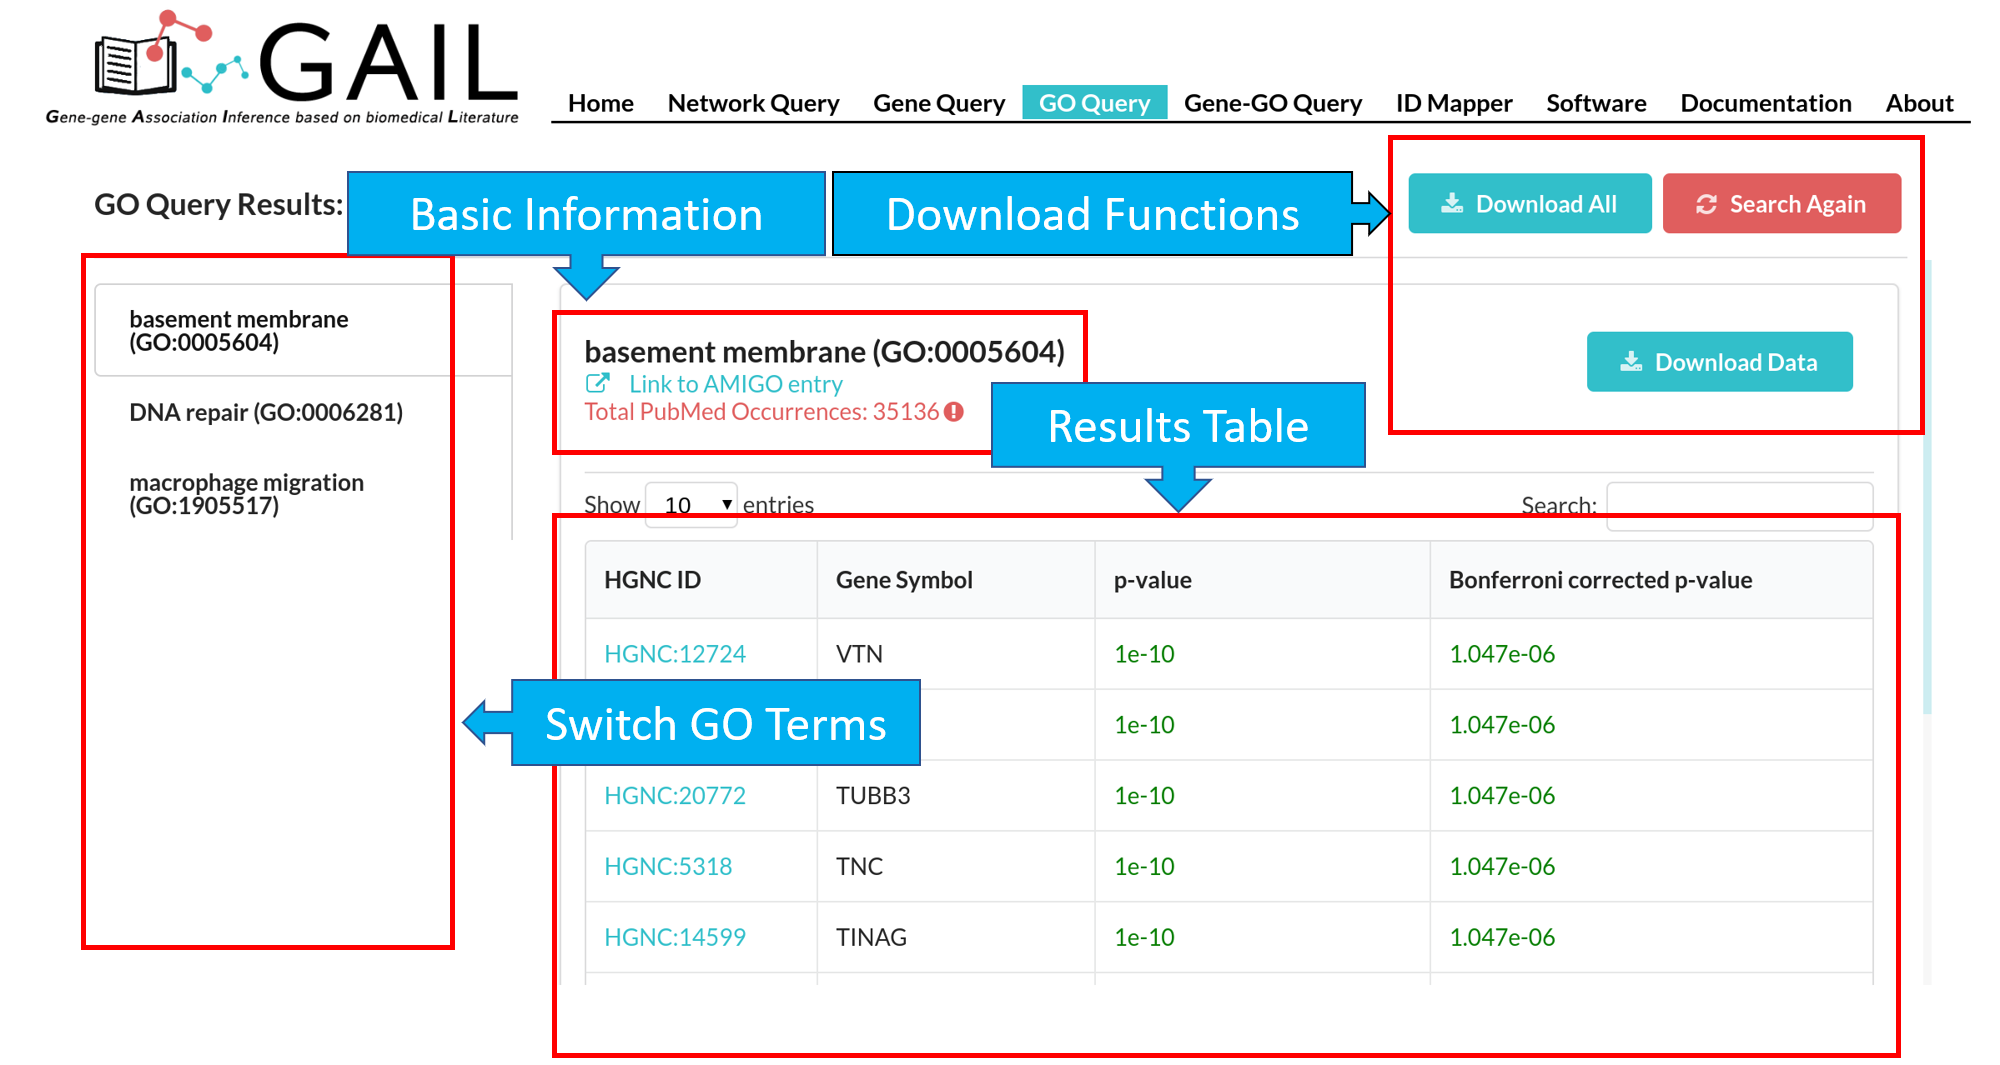
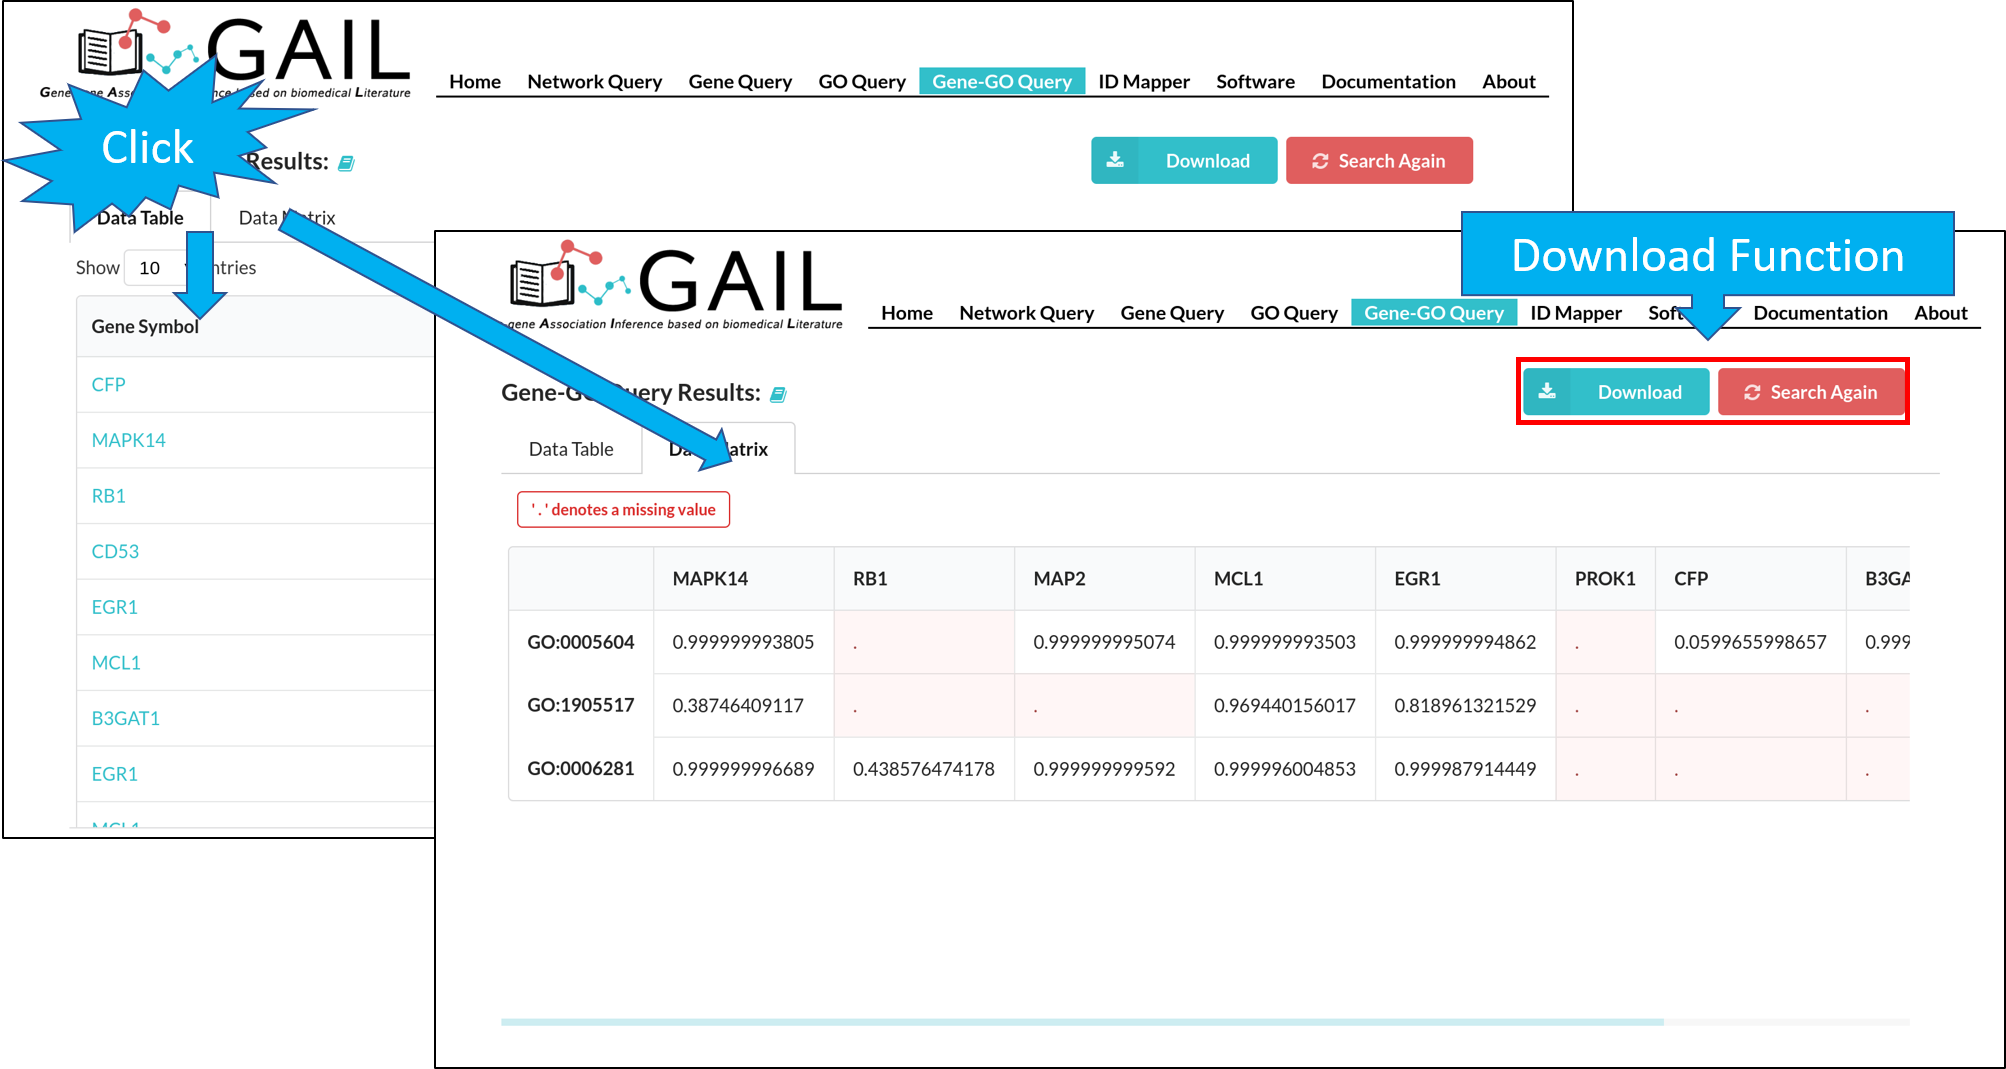
The results page contains following components:
| Advanced Functions | Perform advanced functions (download, community detection, global go analysis) on the gene-gene association network. |
| Tab Menu | Check results in different formats (network visualizaton, data table, data matrix, gene communities). |
| Results Display Box | Display results chosen from the tab menu. Default set to display the network visualization. |
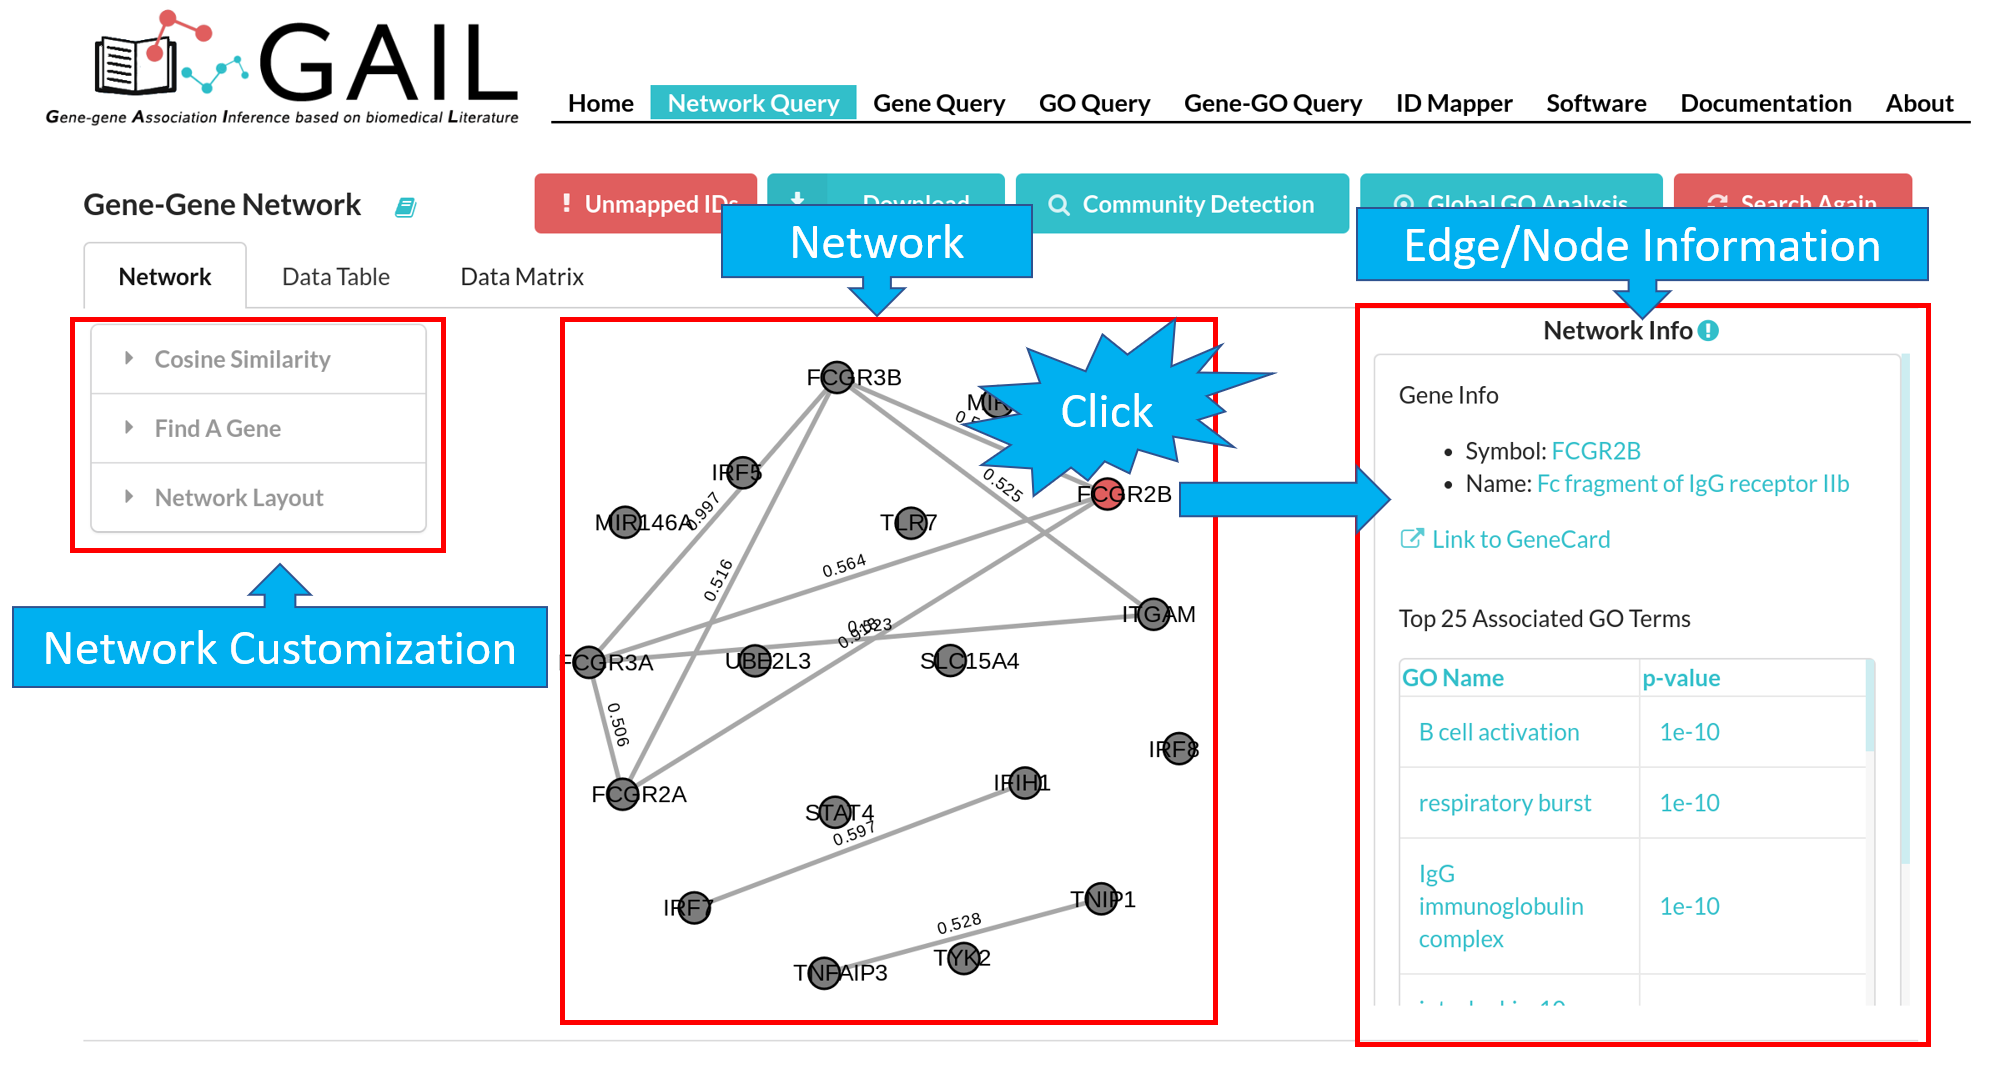
The default network visualization has three panels. The left panel allows you to customize the network layout, the central panel visualize the network, and the right panel allows you to check edge/node information when you click an edge/node.
Advanced Functions
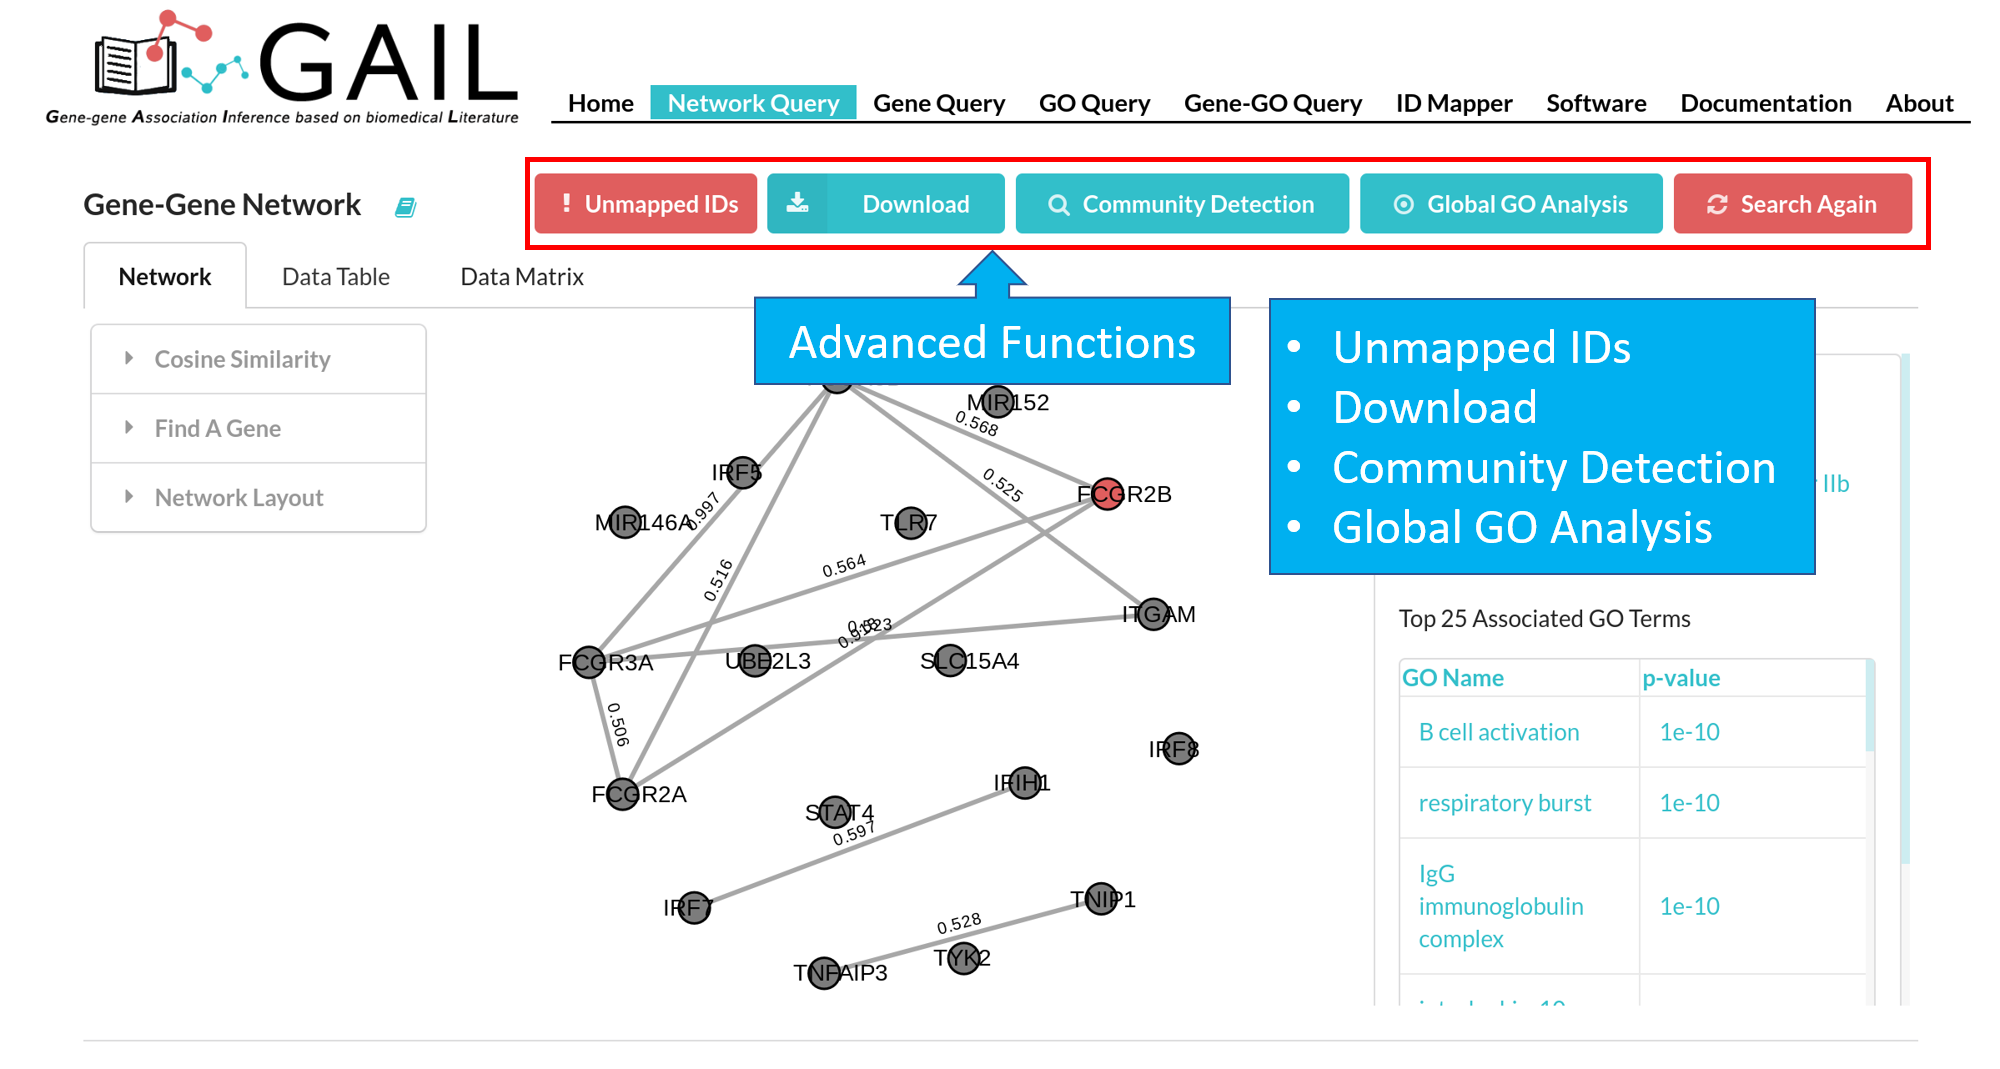
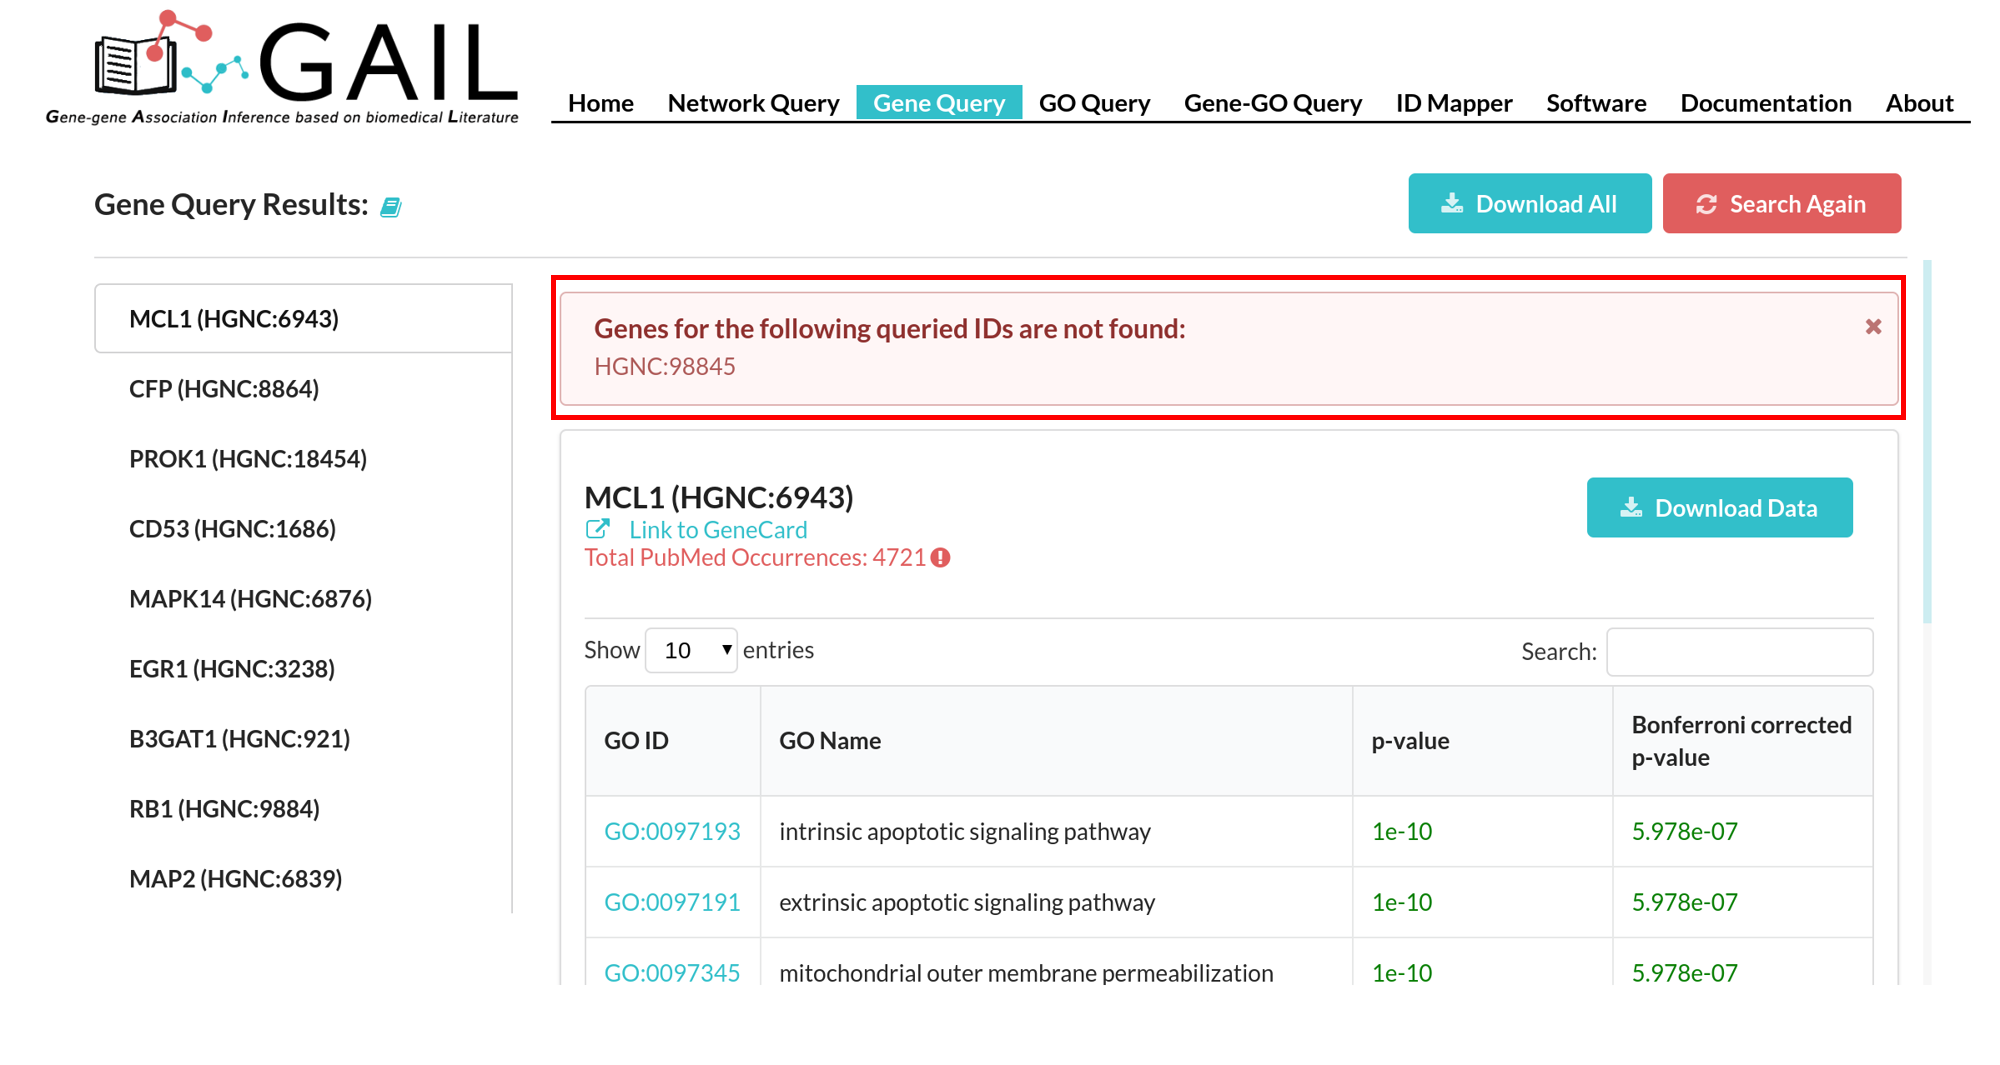
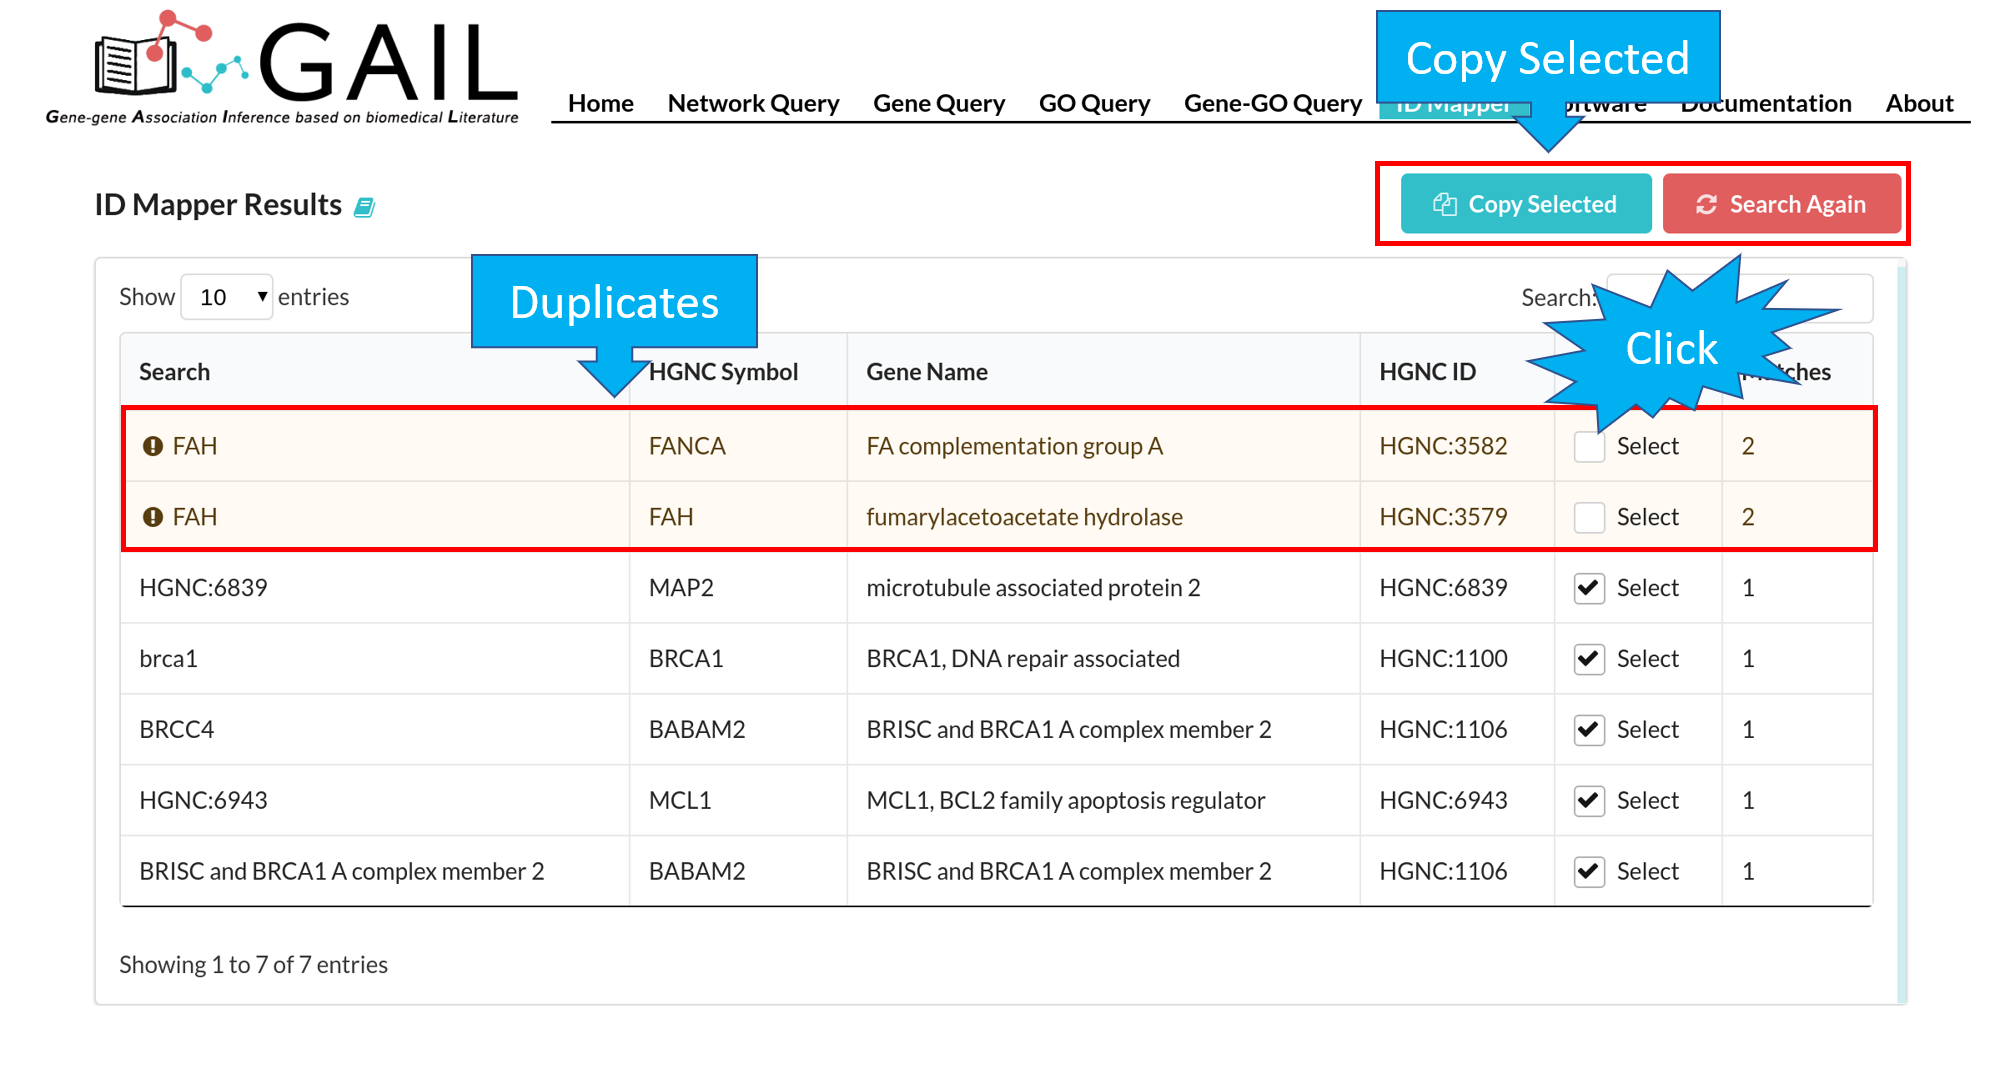
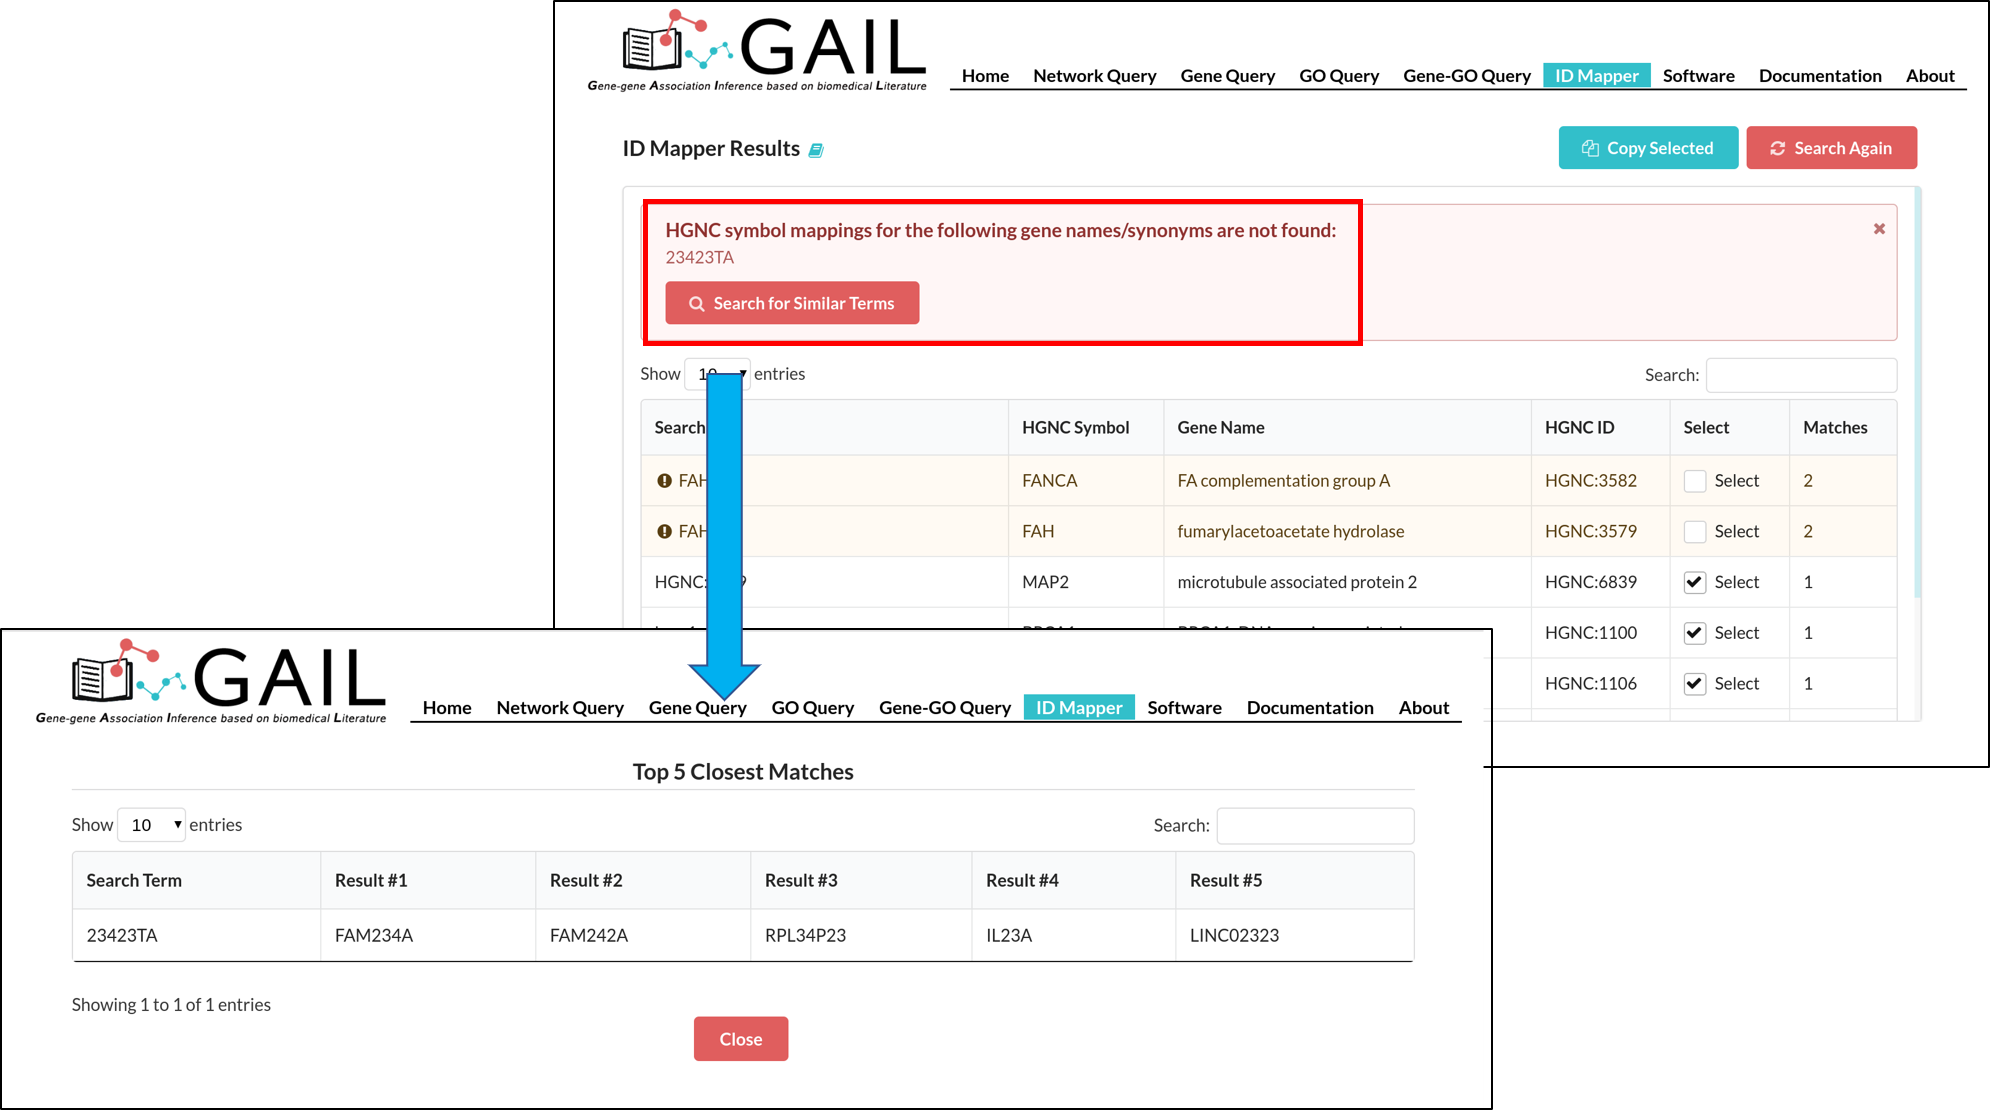
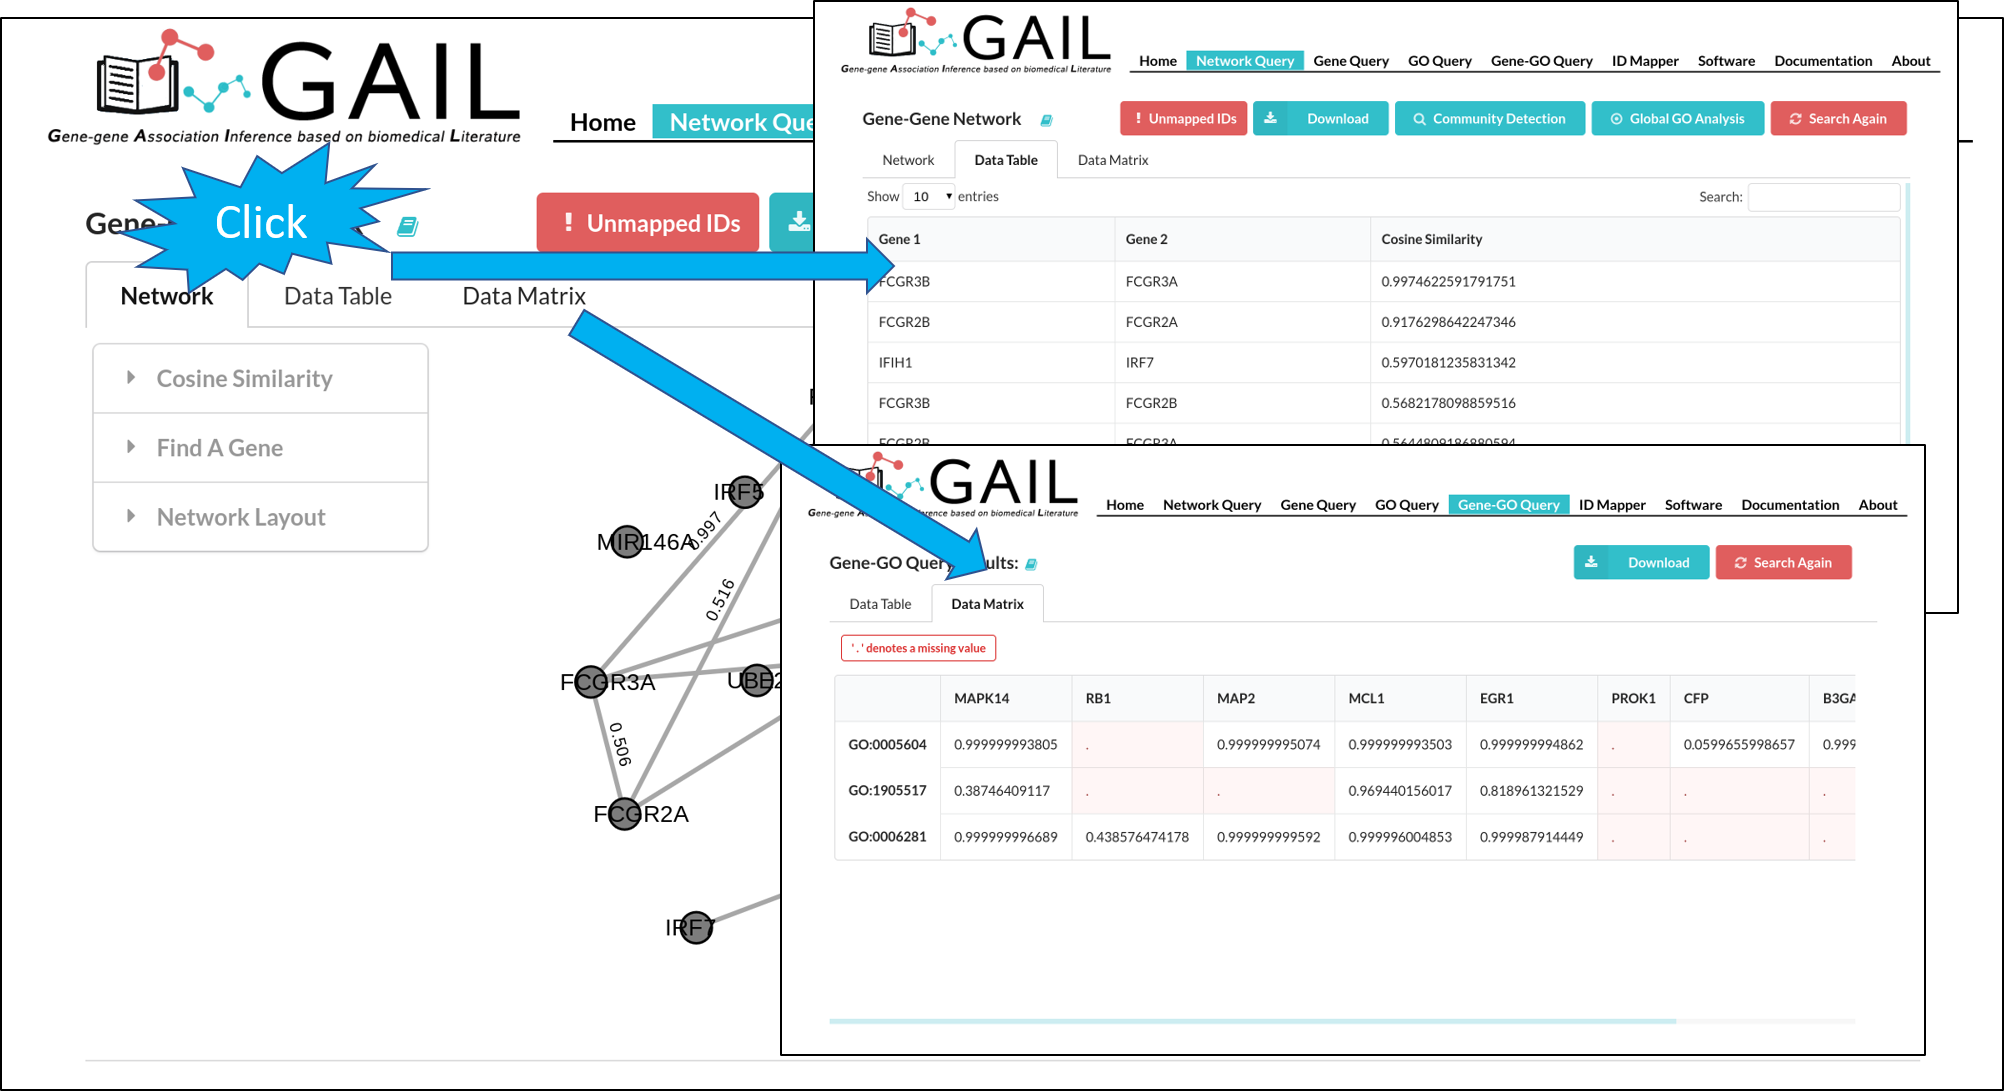
Unmapped Genes
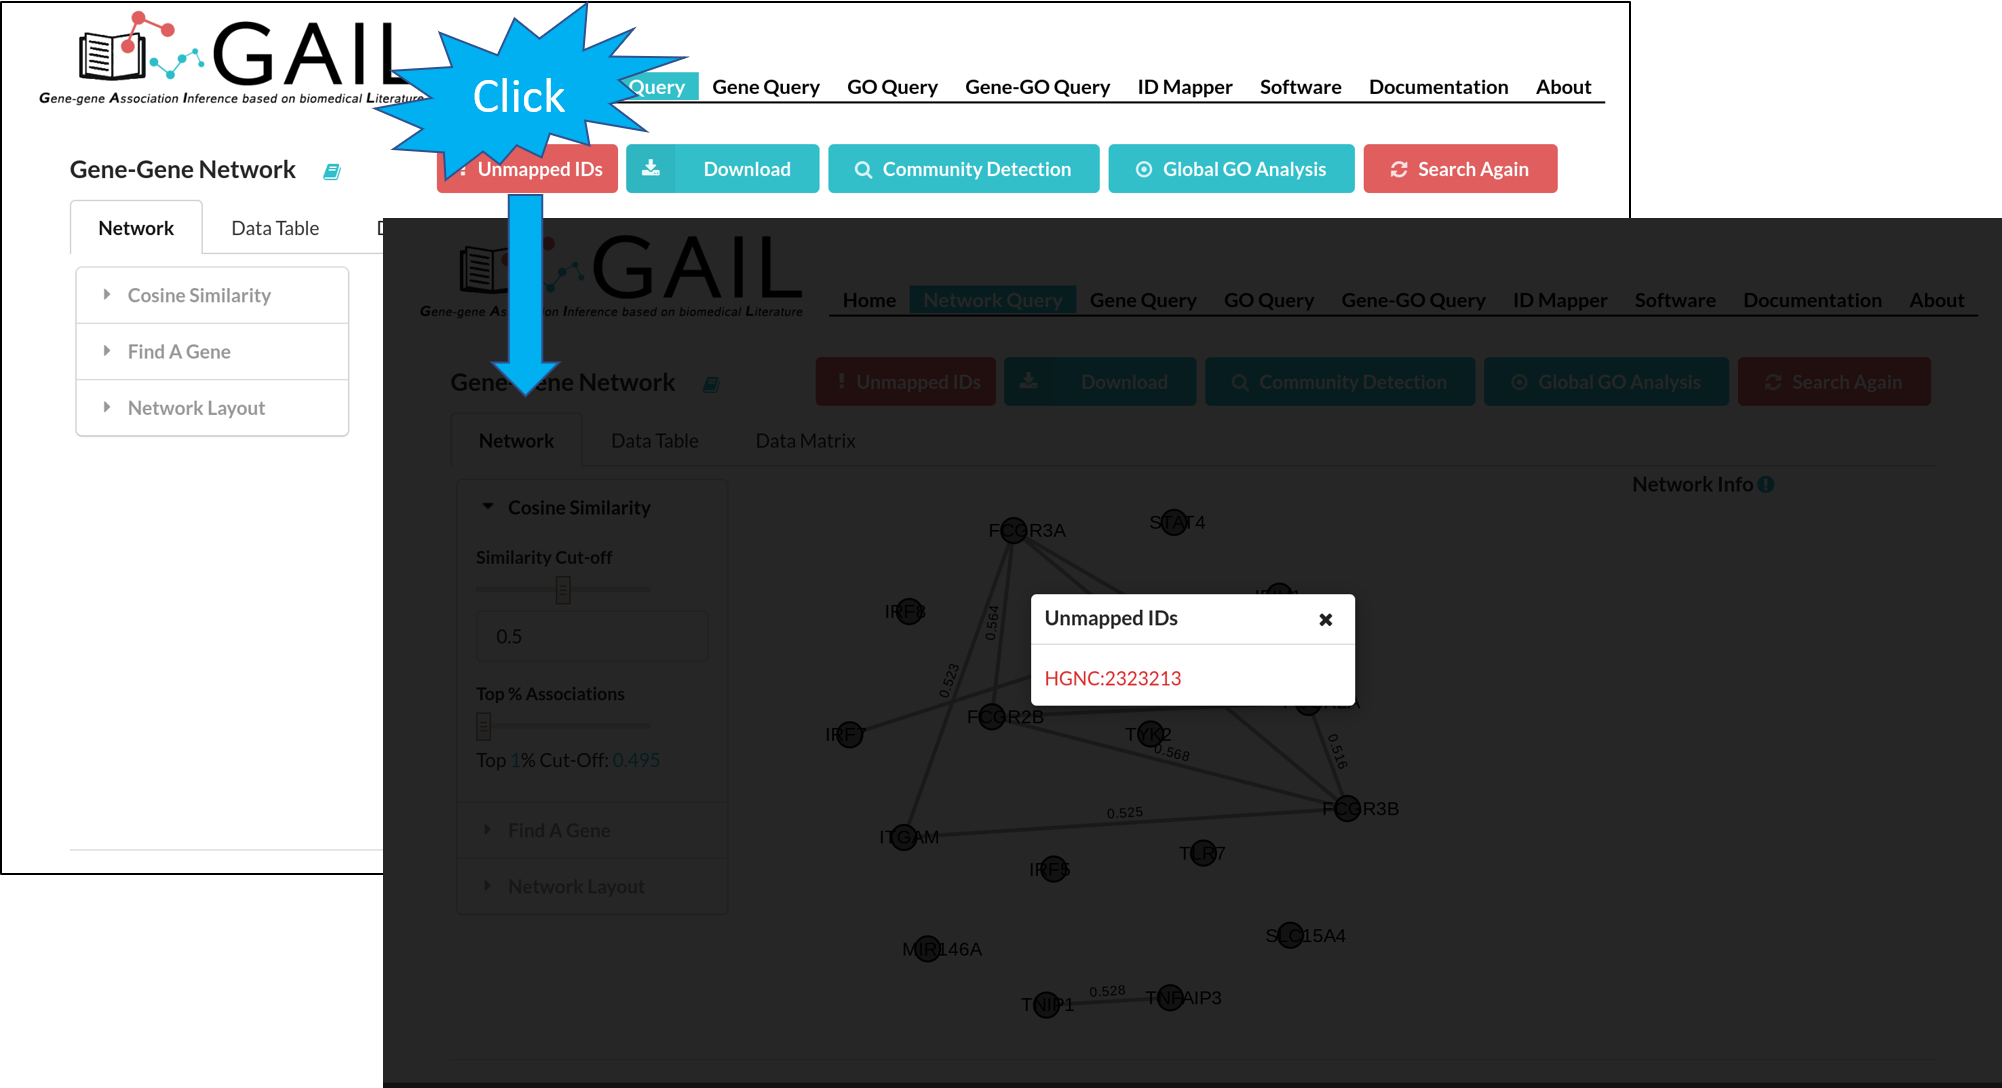
If there are unmatched queried gene IDs, you can check the unmatched IDs by clicking the 'Unmapped IDs' button.
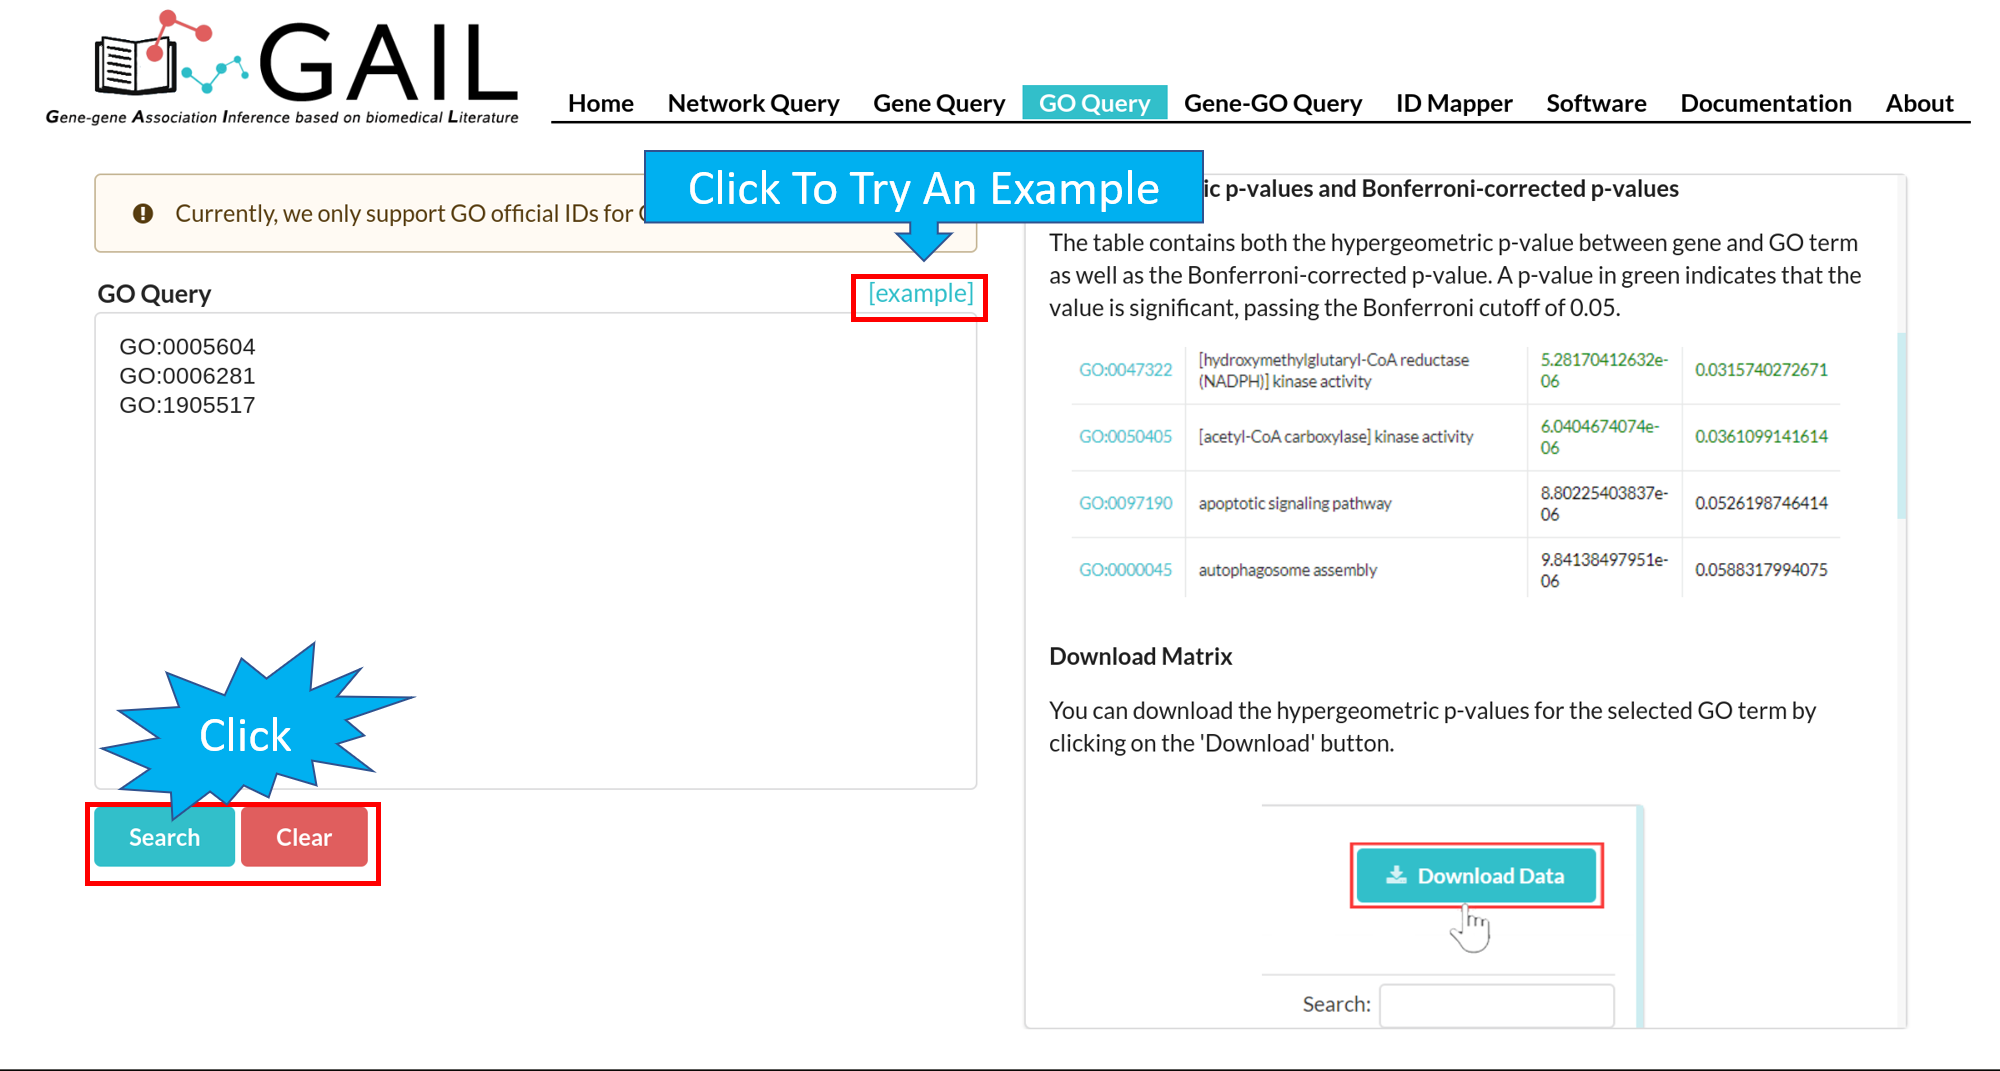
Download
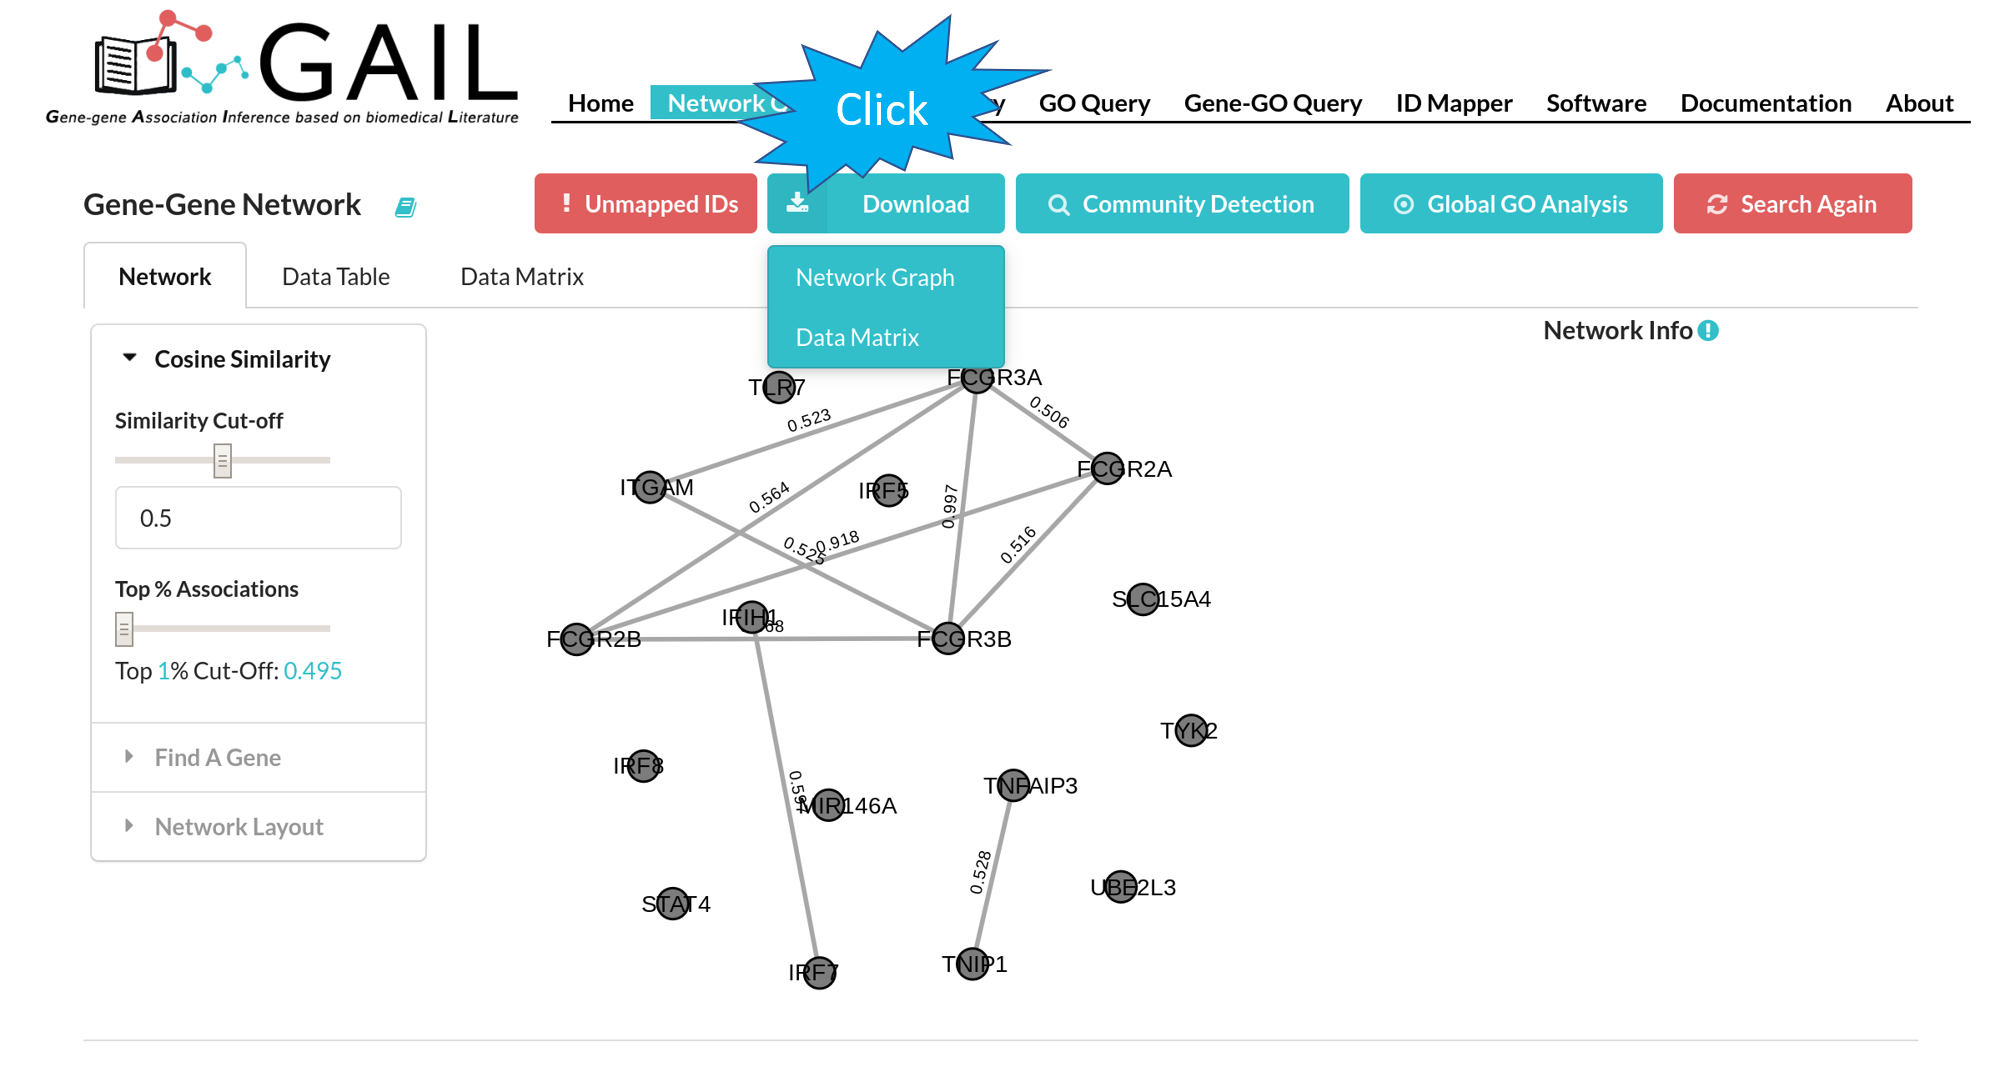
You can download the gene-gene association cosine similarity score matrix in .csv format or the network graph in .png format.
Community Detection
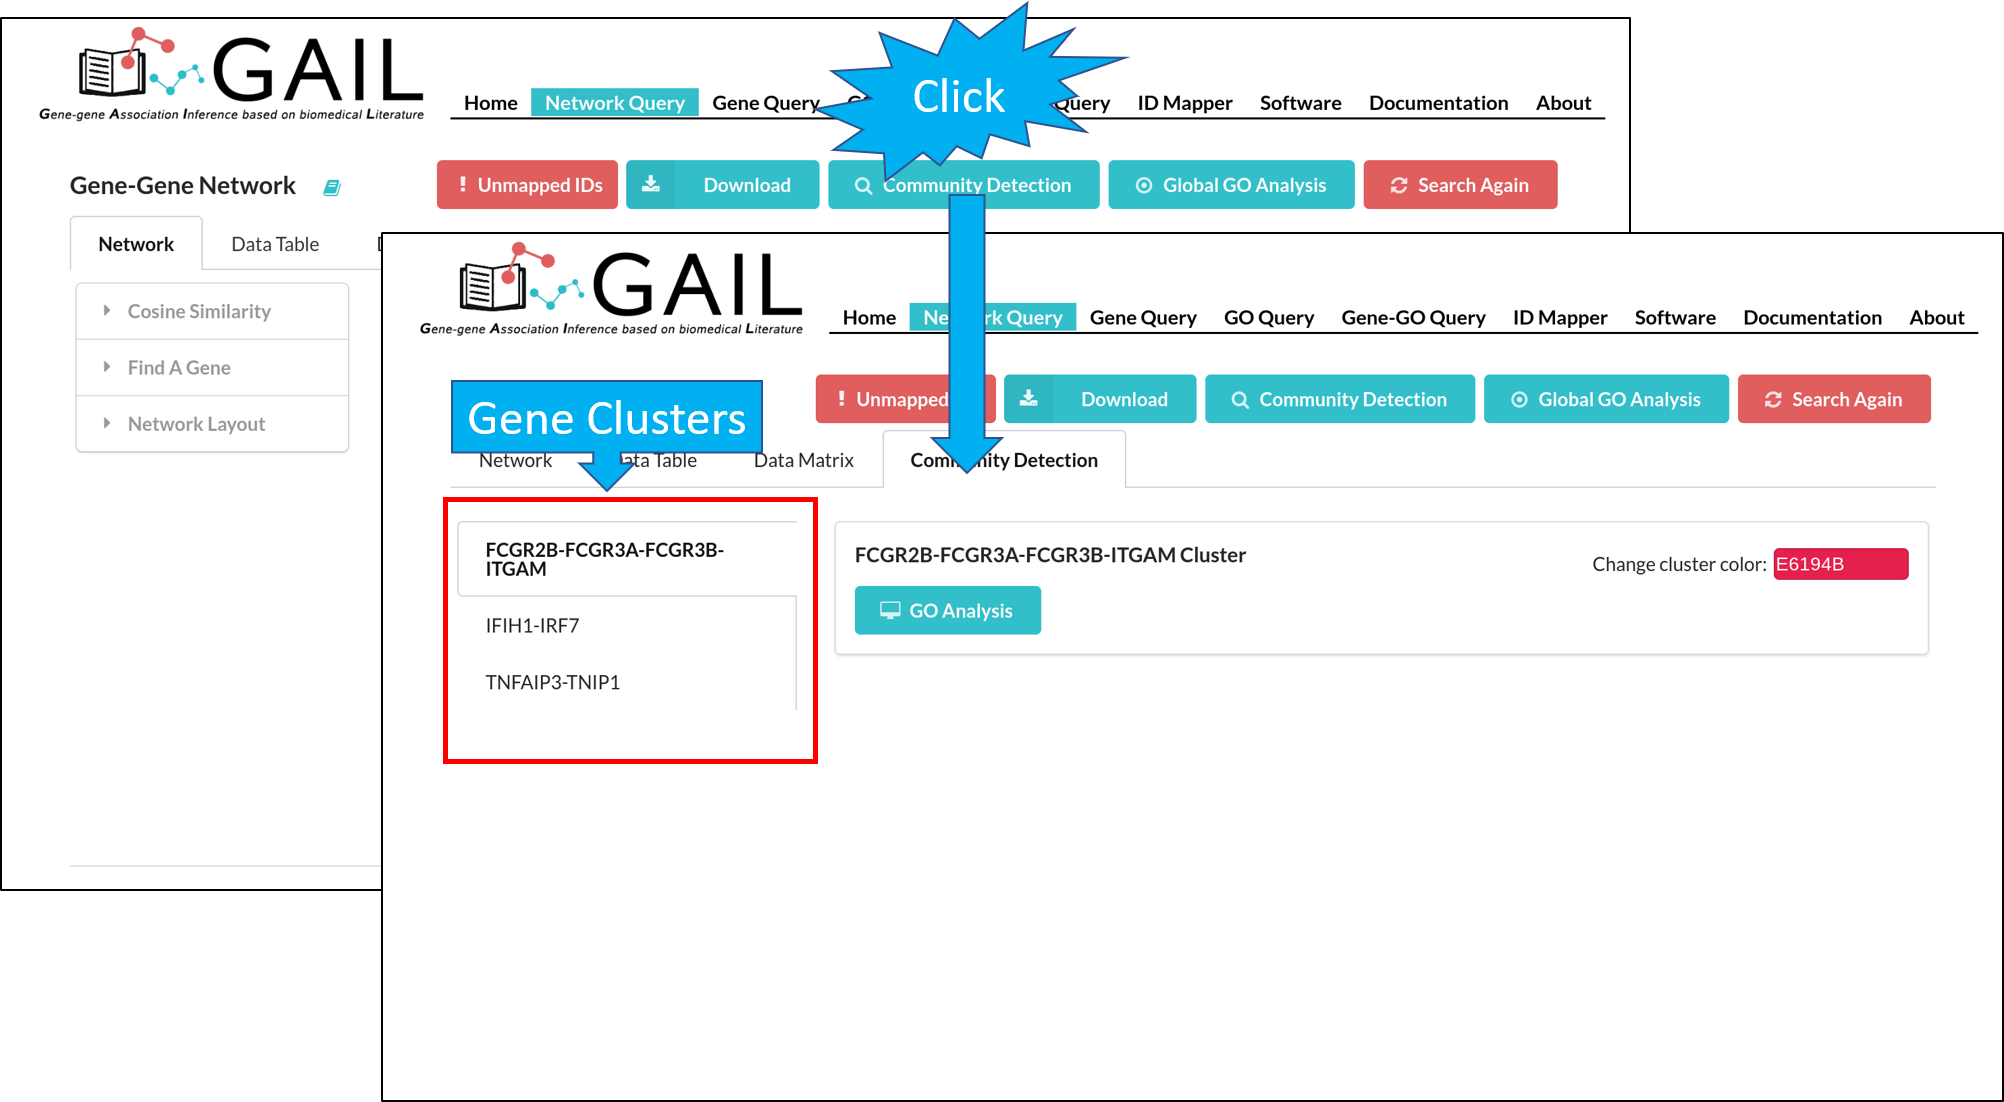
You can perform the community detection among genes to find gene clusters.
Community GO Analysis
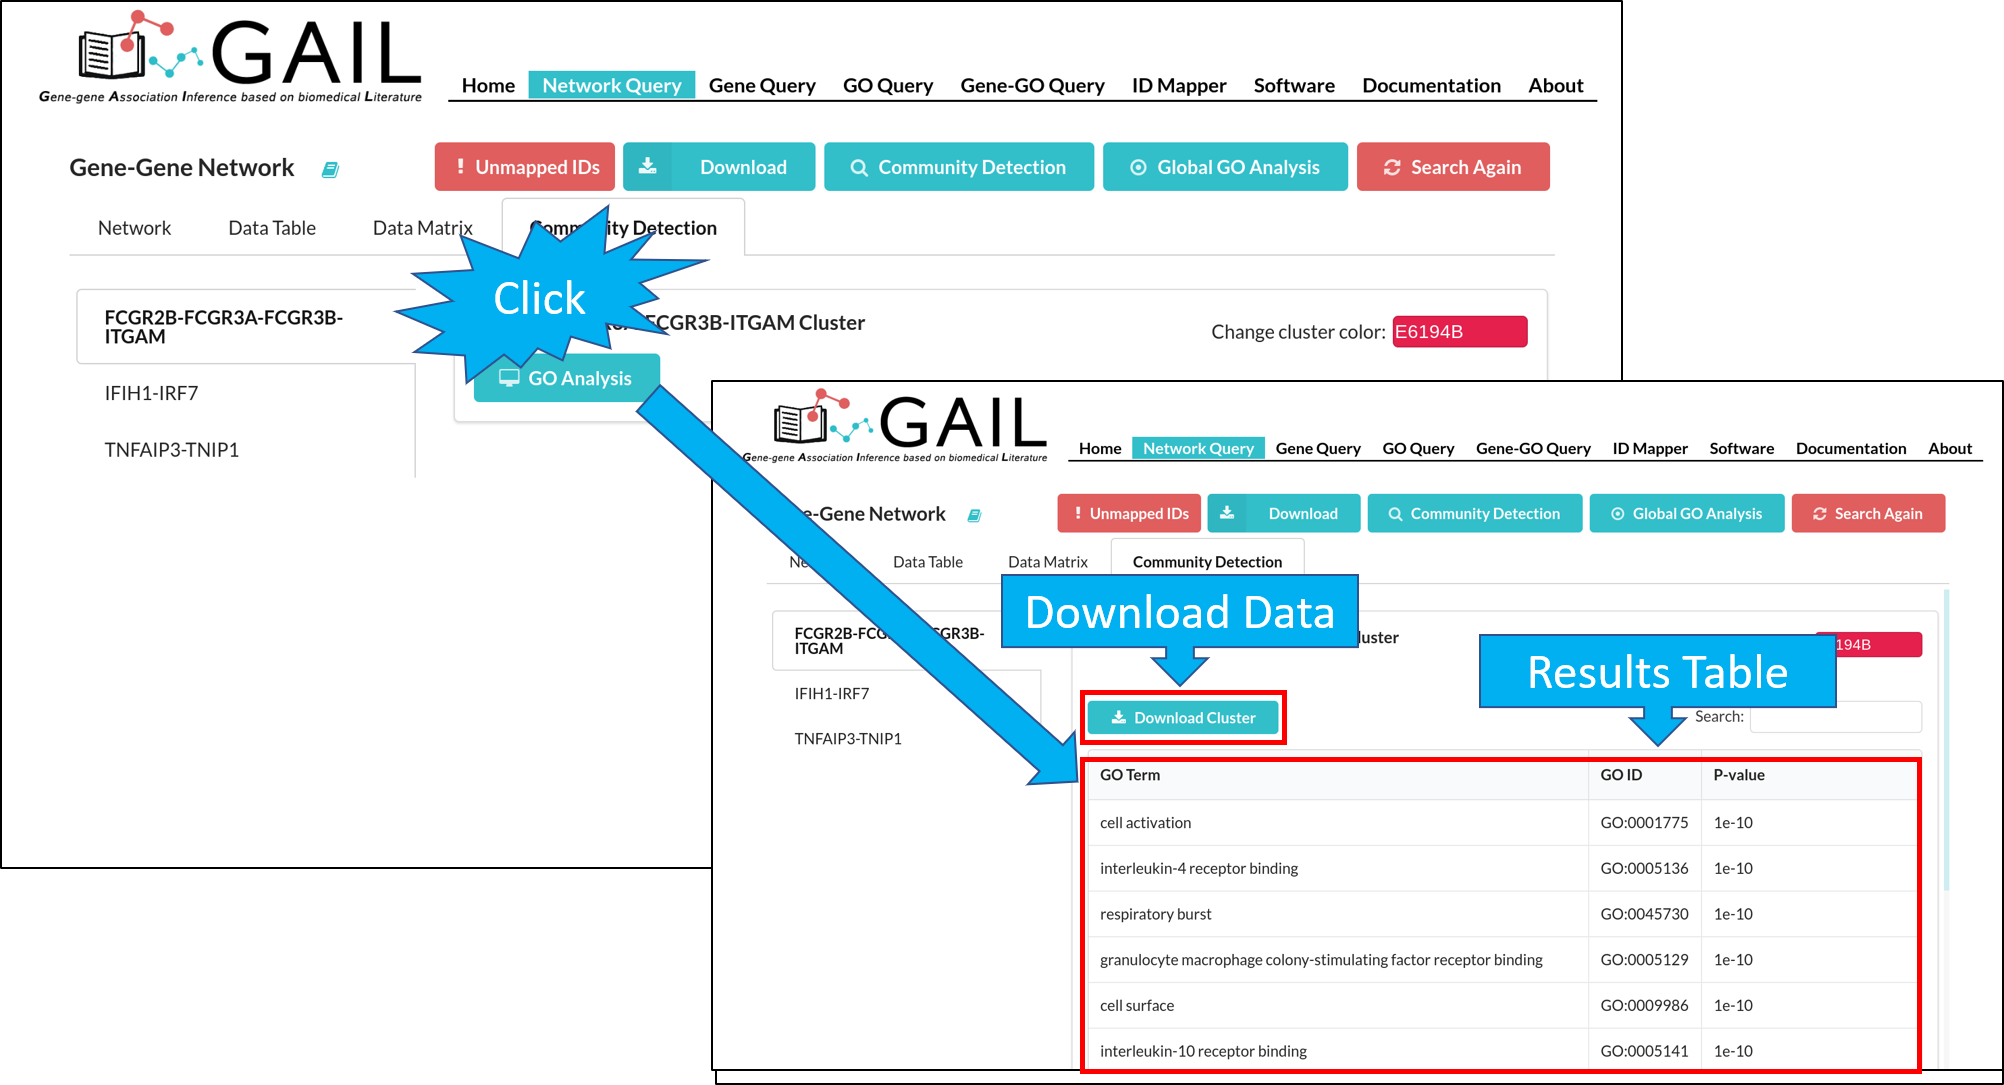
After running the community detection, you can perform a GO analysis on each gene community to find top GO terms associated with the community.
Change Community Color
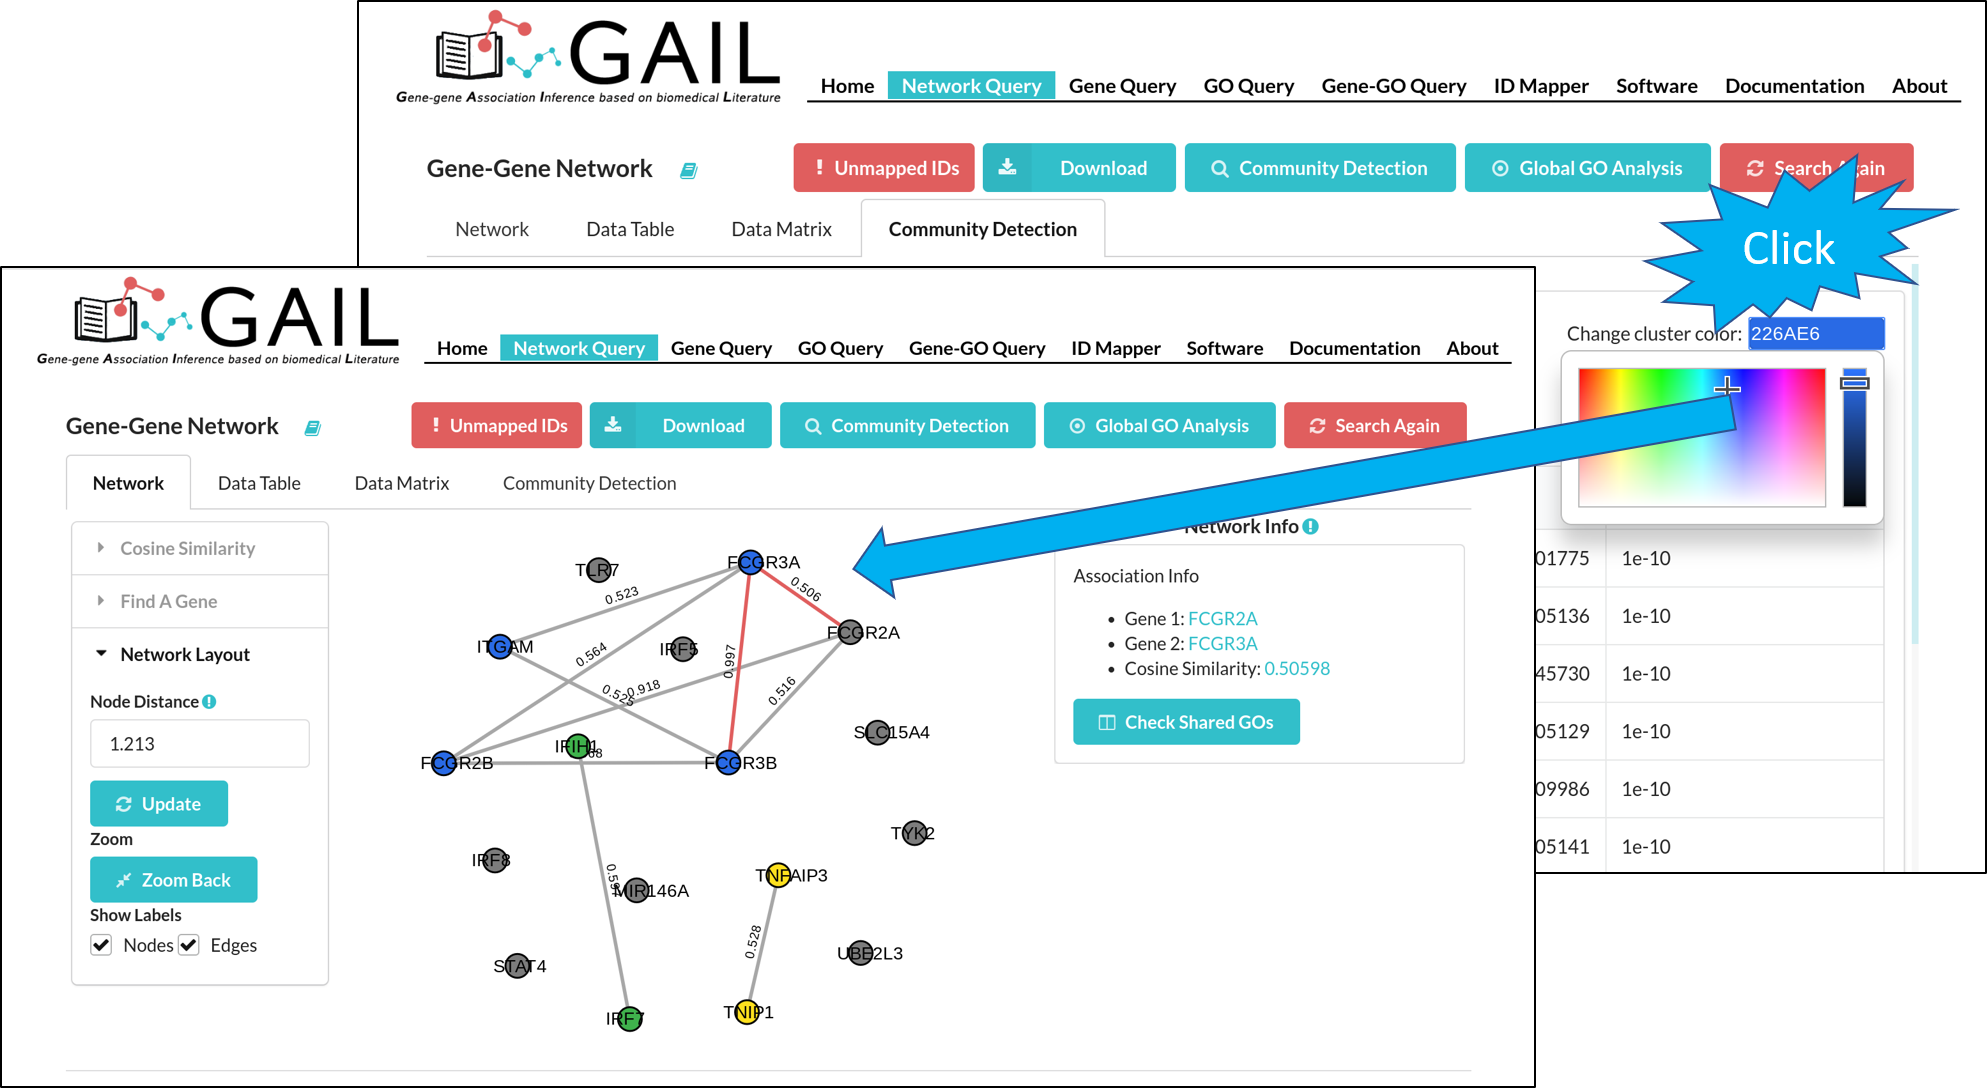
After running the community detection, each gene cluster is highlighted with a distinct color. You can also change the cluster color using the color picker in each cluster page.
Global GO Analysis
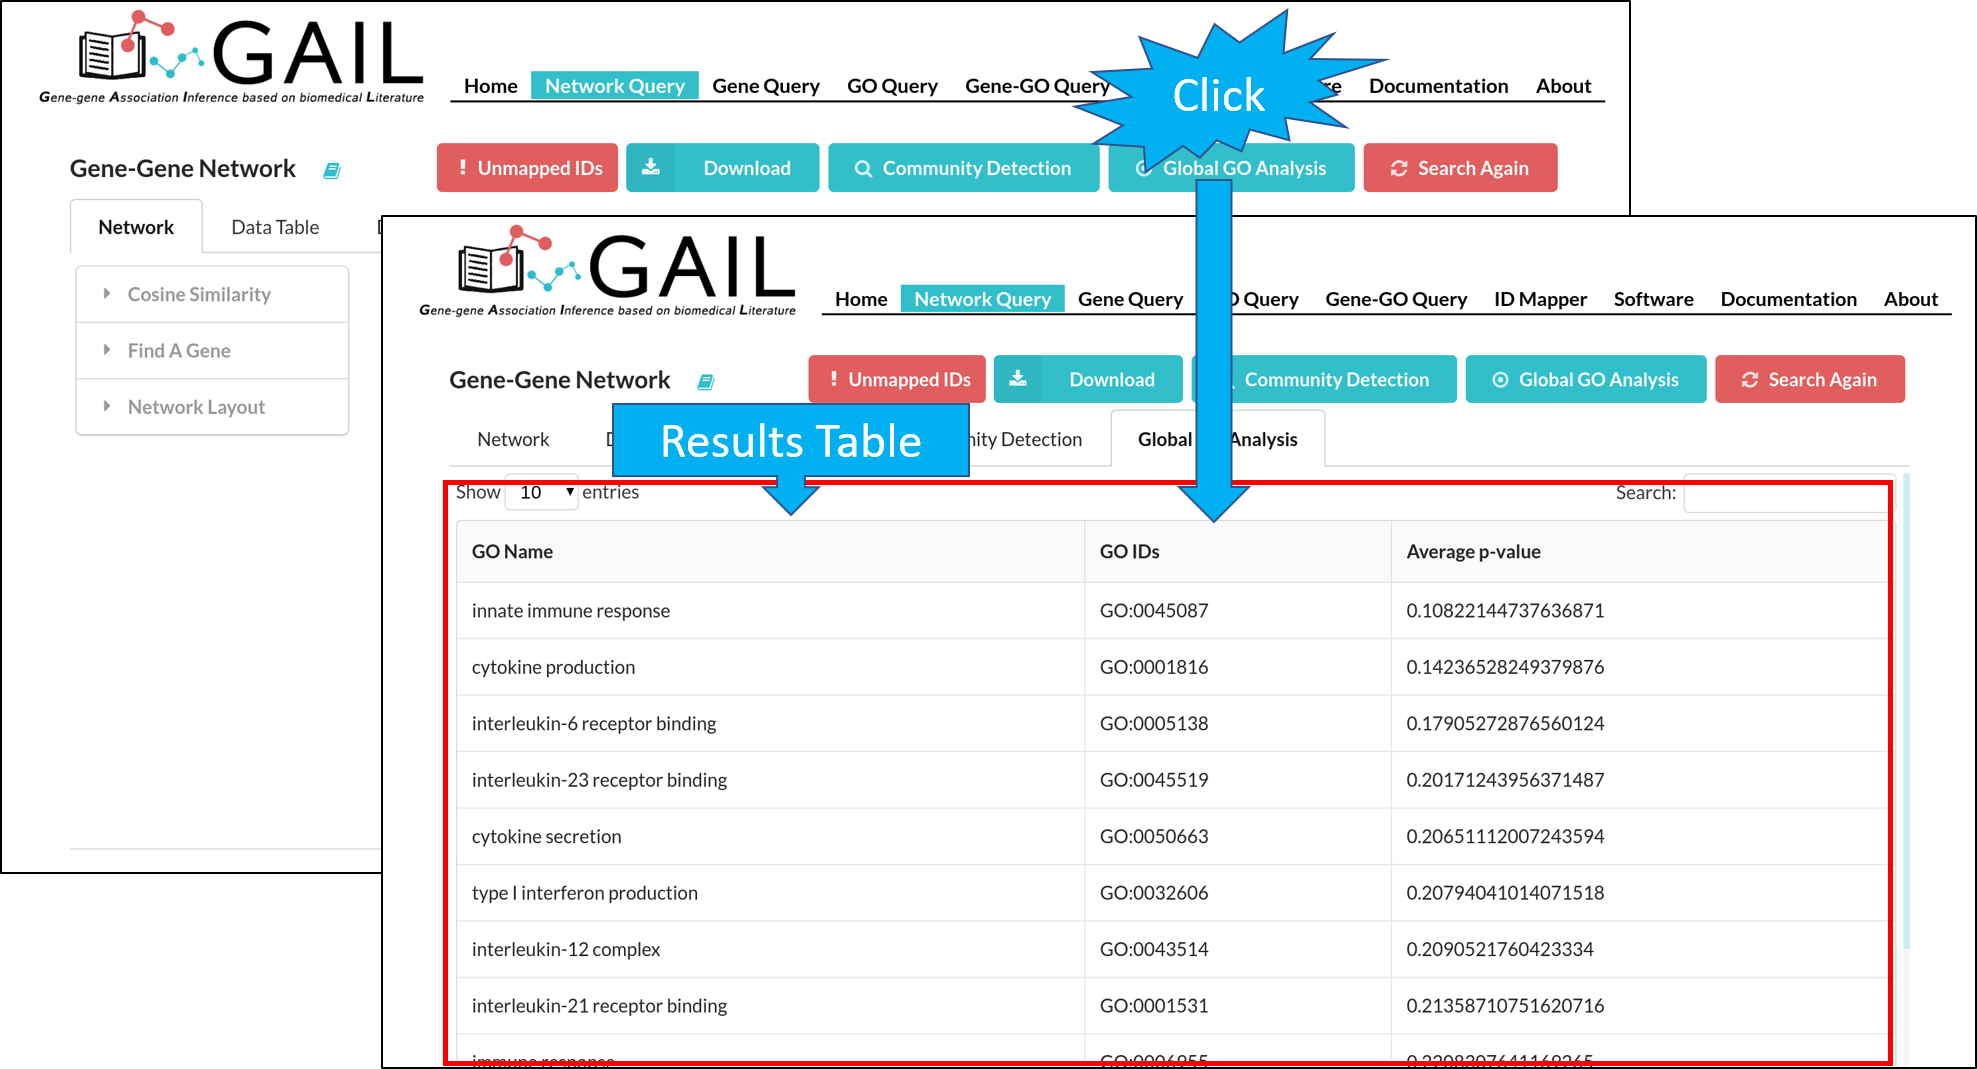
You can run a global GO analysis to find top GO terms associated with queried genes. This is determined by calculating the average p-values of gene-GO associations among all queried genes.
Tab Menu
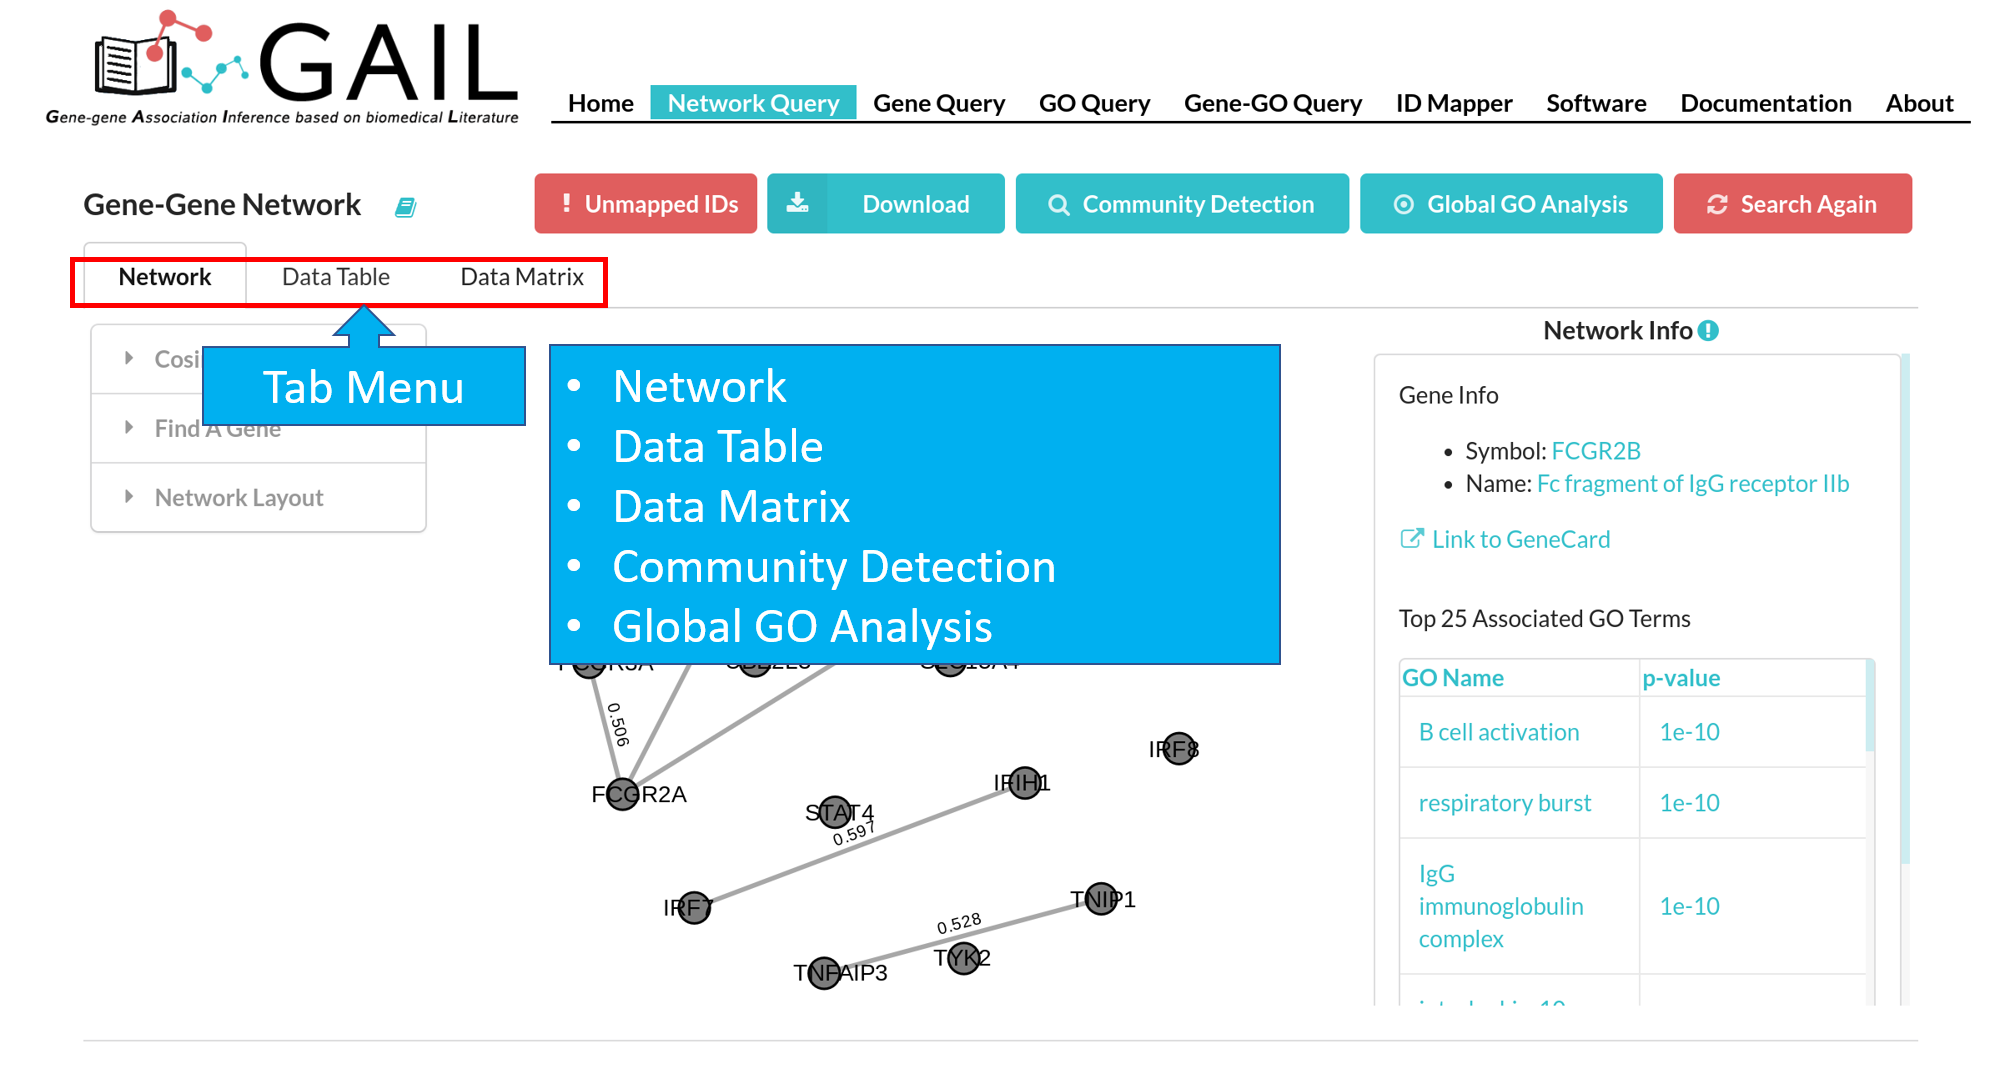
The 'Community Detection' and 'Global GO Analysis' will appear when corresponding advanced functions are ran.
Network
You can view the network visualization in the network tab.
Network Data View
You can view the gene-gene associations and their cosine similarity scores in a long table format or a matrix format.
Network Customization
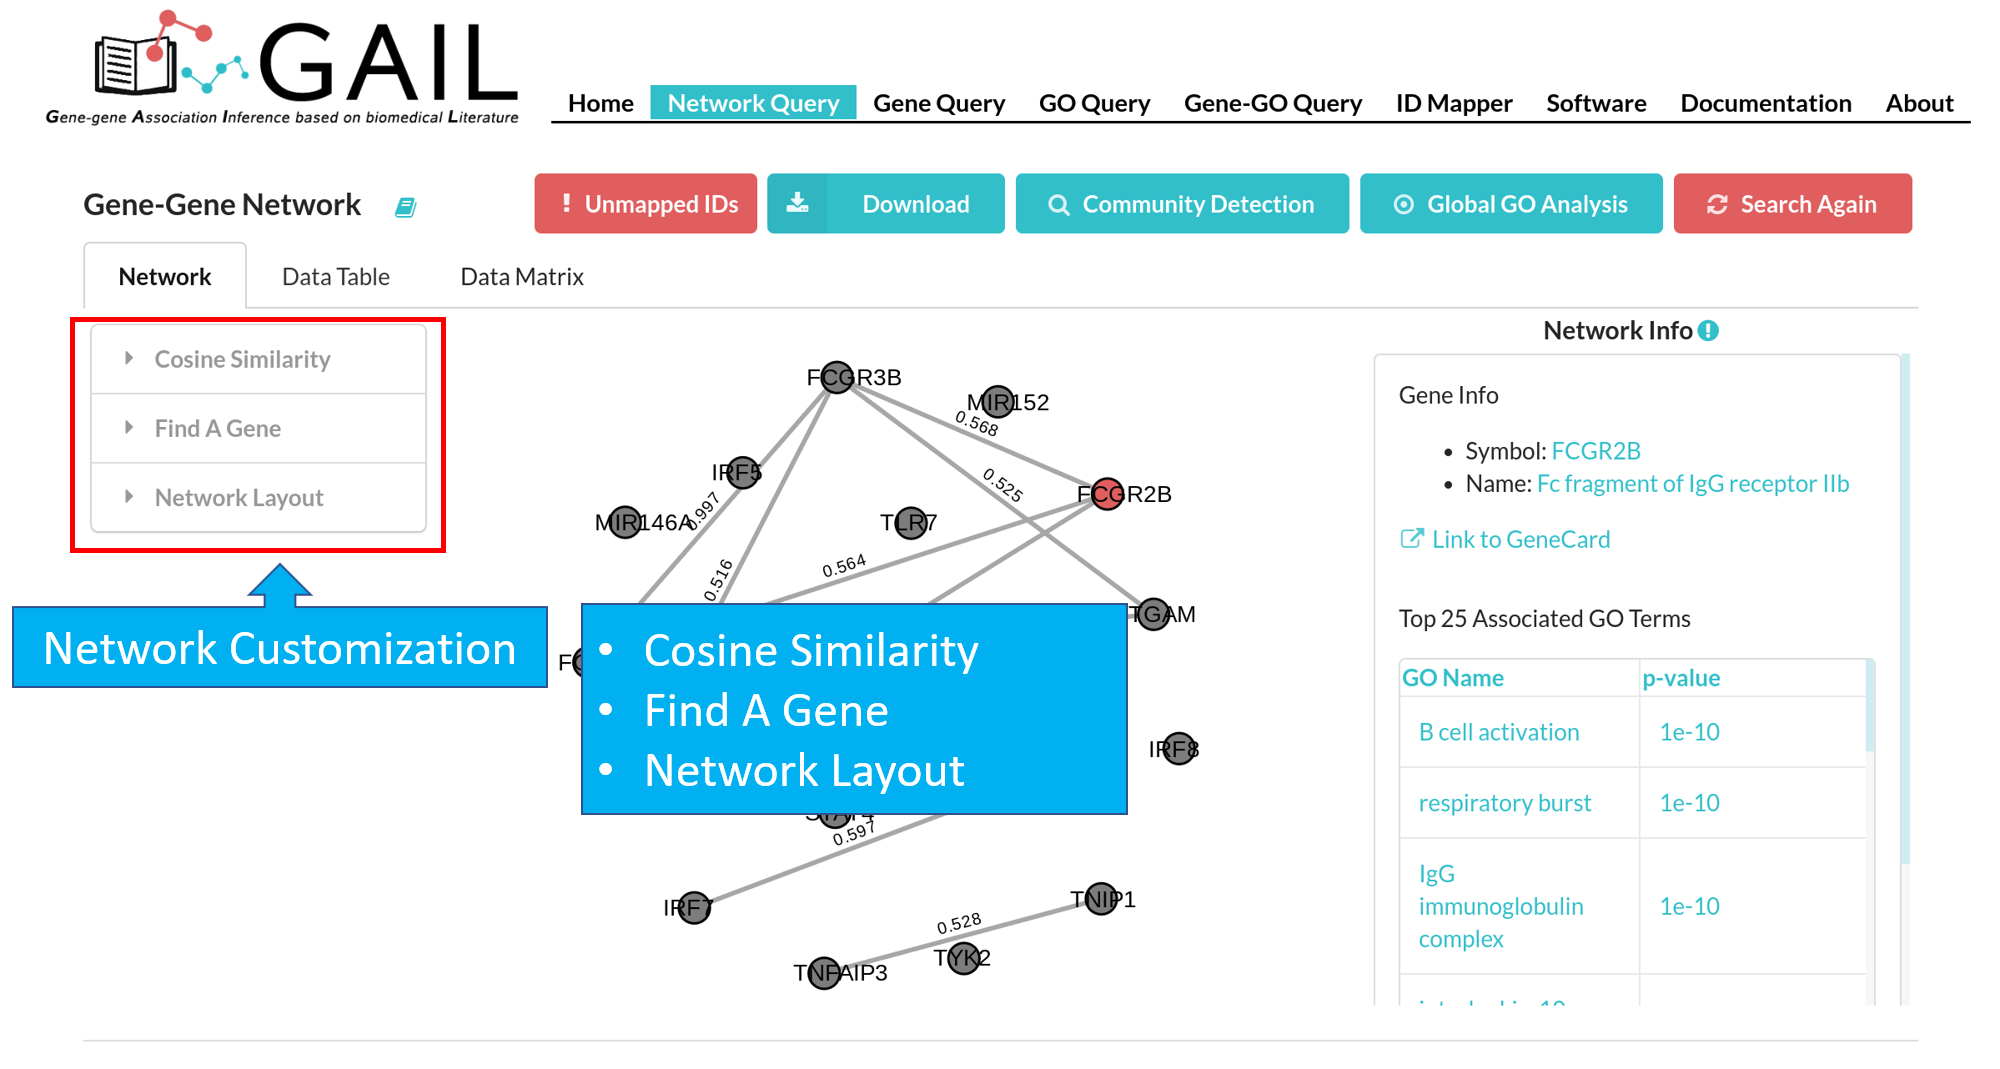
Cosine Similarity
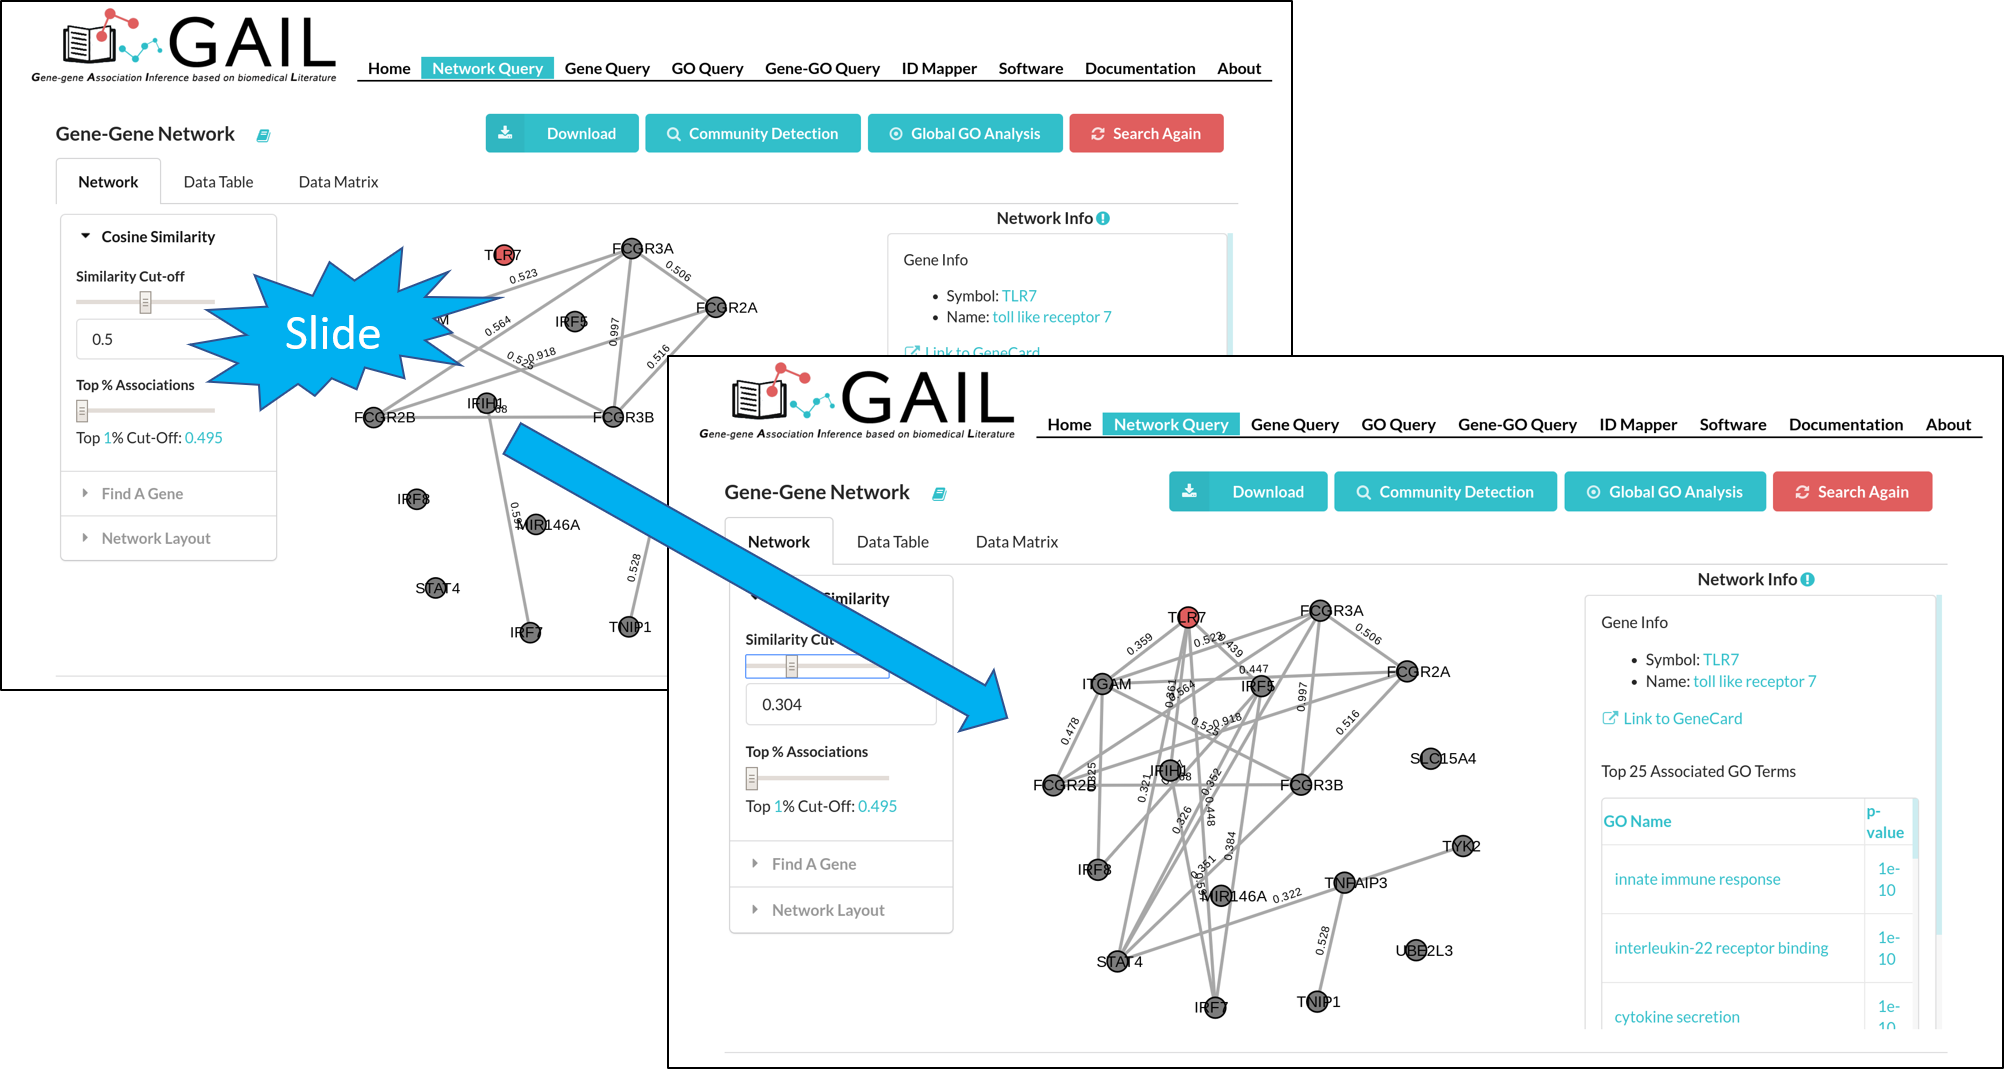
The gene-gene association network is constructed based on cosine similarity scores. Two genes are linked by an edge if their cosine similarity score is larger than a threshold (default:0.5). You can change the cosine similarity threshold to modify the network. In addition, you can choose the threshold by percentiles.
Find A Gene
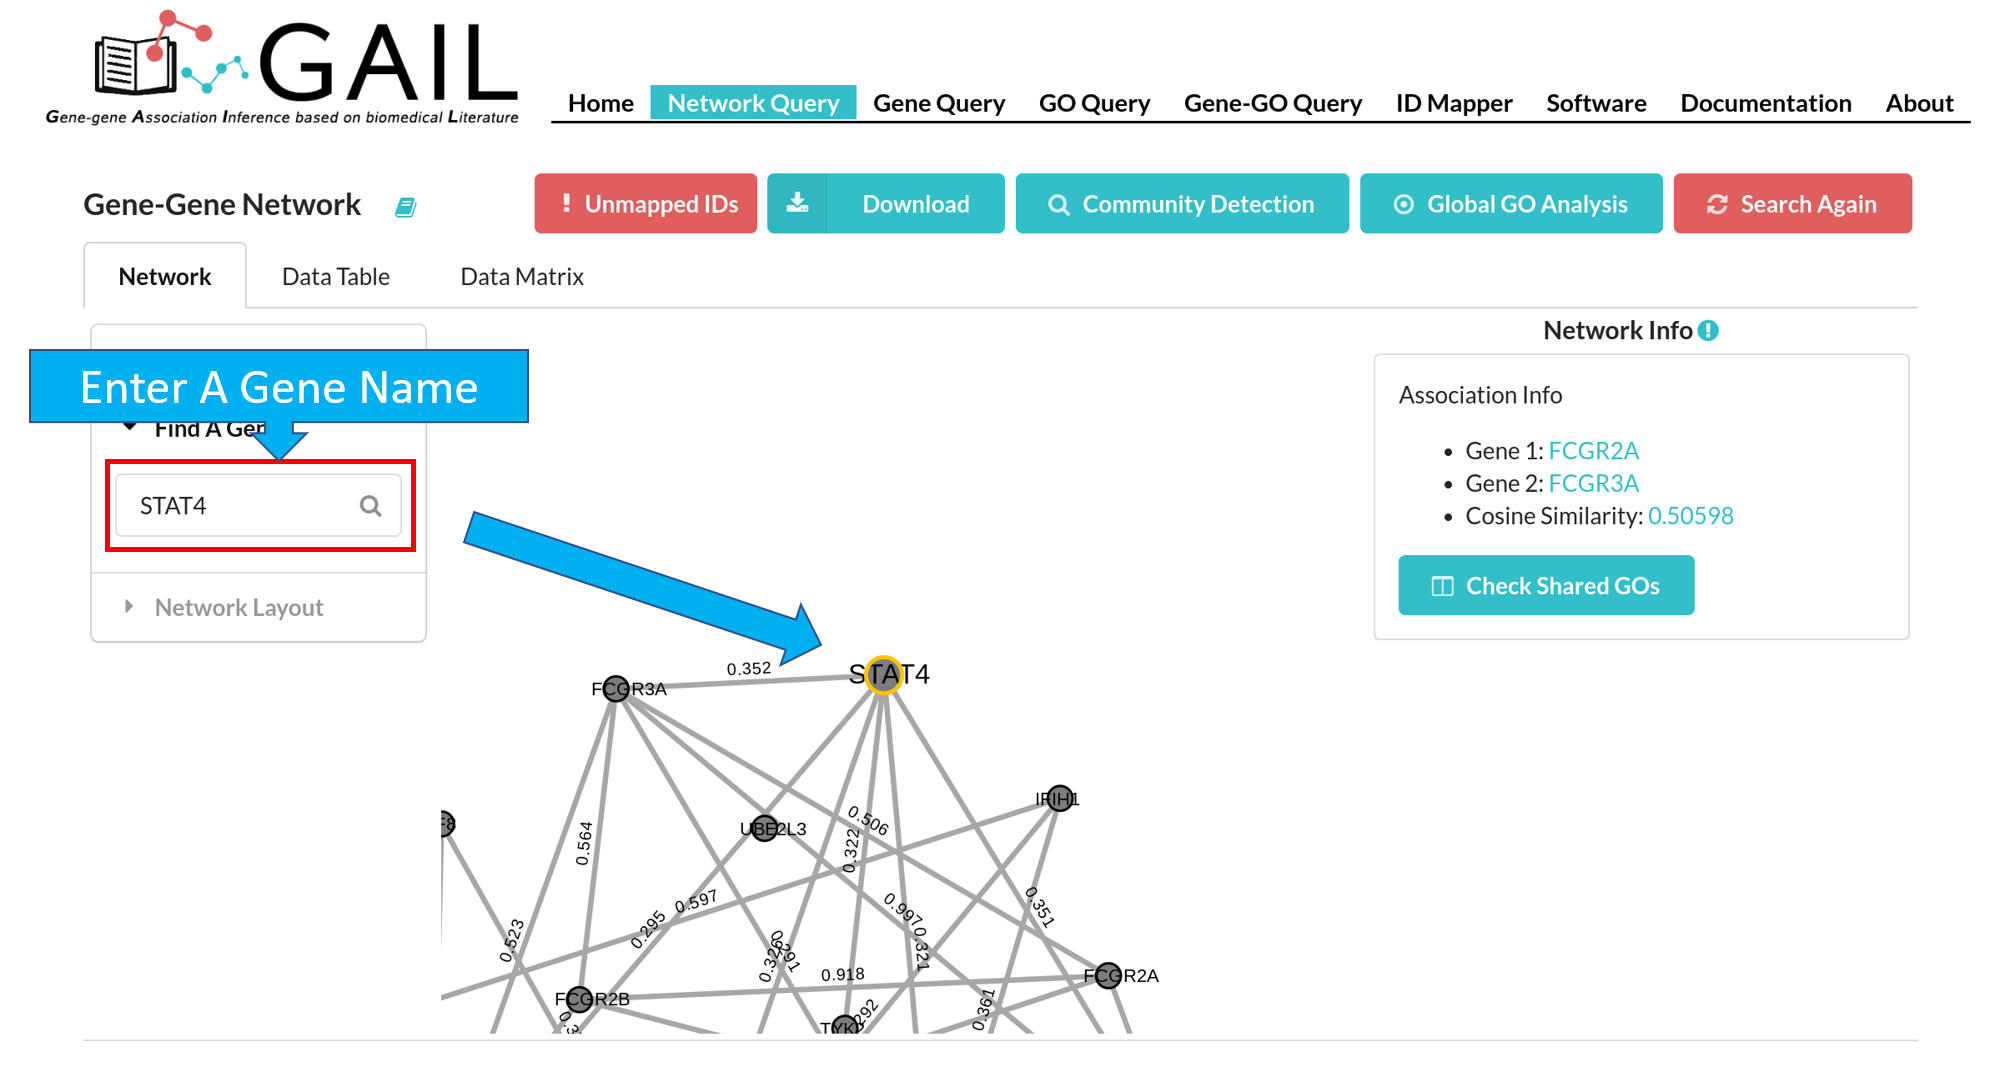
You can zoom the network to a specific gene by using the 'Find A Gene' function. The found gene node is highlighted with a orange border.
Network Layout
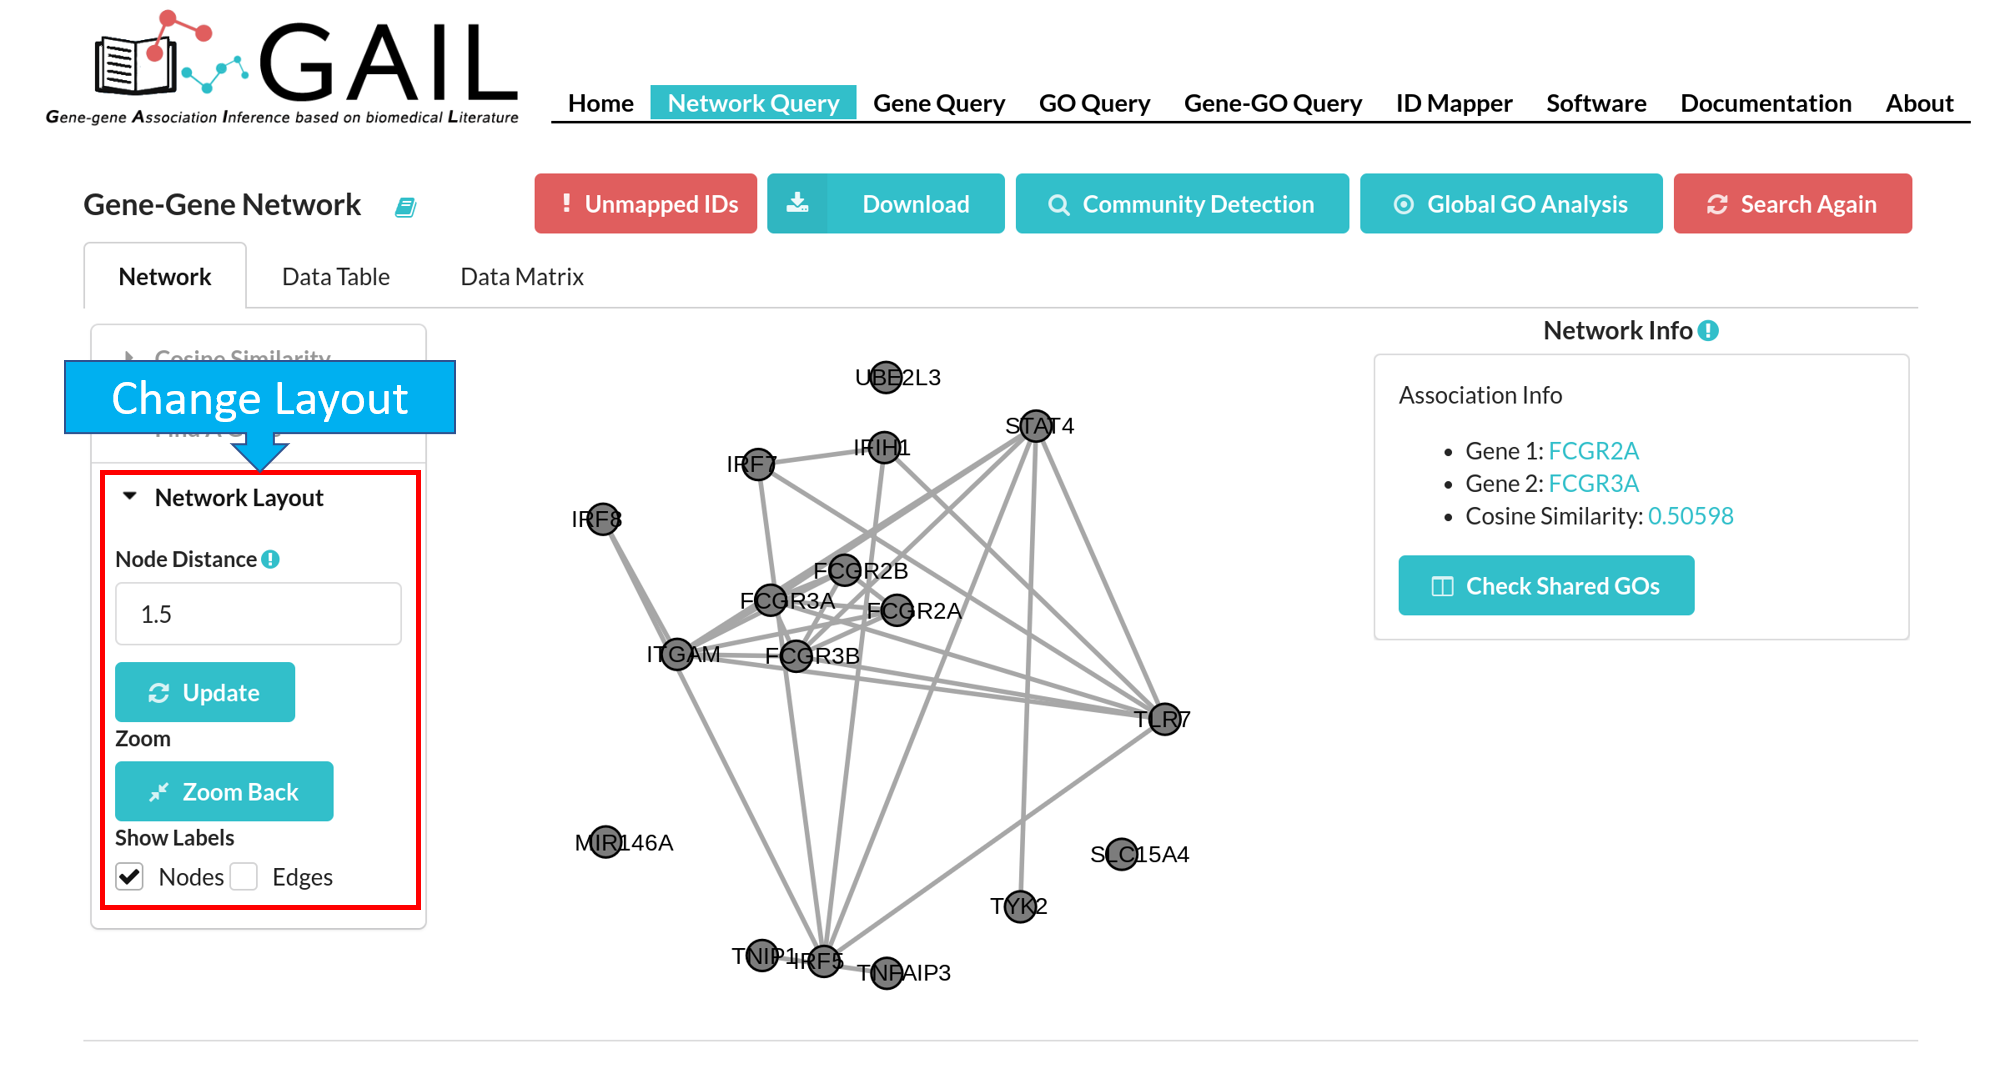
You have following options to change the network layout:
| Node Distance | Adjust the visual distance between two gene nodes. After set the node distance, you should click the 'Update' button to update the visualization. |
| Zoom Back | Reset the network to original position and size. |
| Show Labels | Show/hide labels for genes (gene symbol) and associations (cosine similarity score). The default option displays both gene and association labels. |
Edge/Node Information
You can check edge/node information when clicking an edge/node. We provide following information for edge/node:
| Node (Gene) | Gene symbol, gene name, link to GeneCard, top 25 associated GO terms with that gene. |
| Edge (Gene-Gene Association) | Two gene symbols, cosine similarity score |
Shared GO Terms
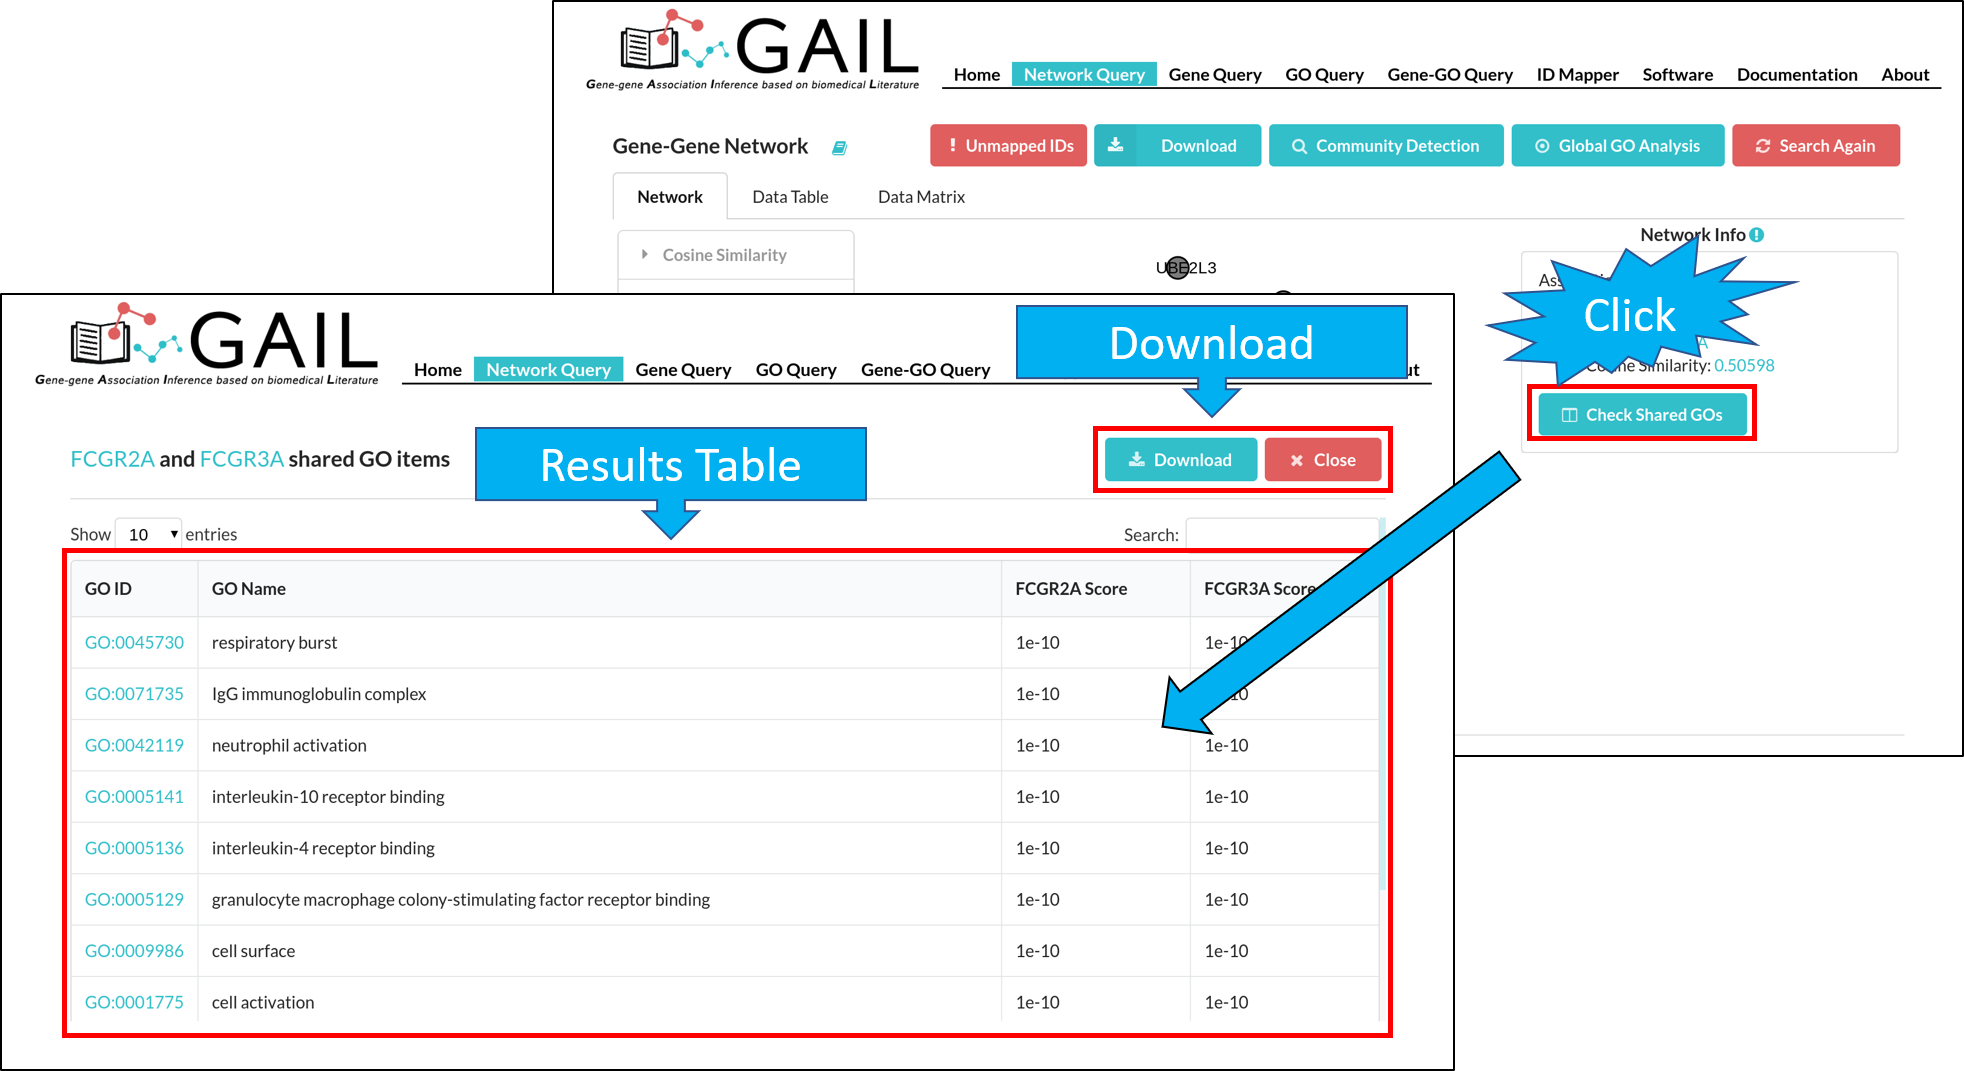
You can check shared GO terms between two genes when clicking on an edge. You can click the 'Checked Shared GOs' button to run the check function. This will display the top GO terms shared by two genes.